Projects
This is a small selection of the projects that InfraVis has conducted
-
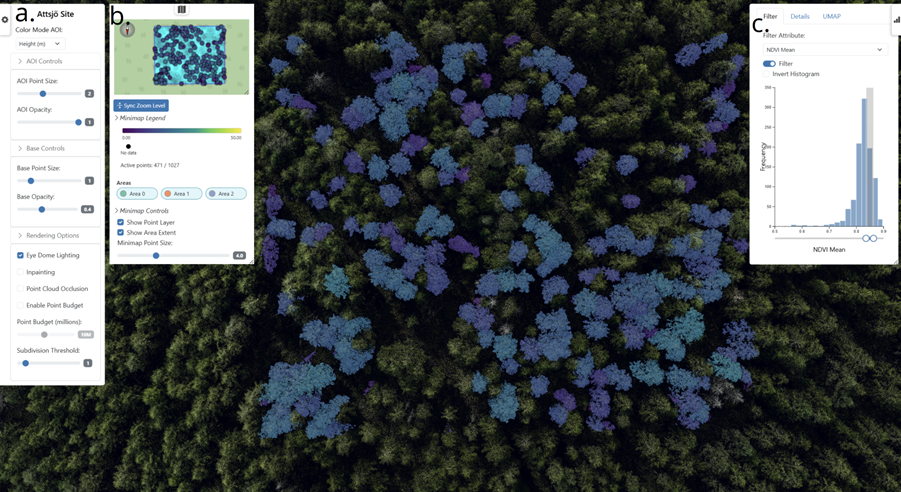
ForestVis: Visualizing Individual Tree Characteristics in Forest 3D Point Clouds Using Remote Sensing Data
ForestVis is a web-based 3D visualization system for the interactive visual exploration of forest data.
-
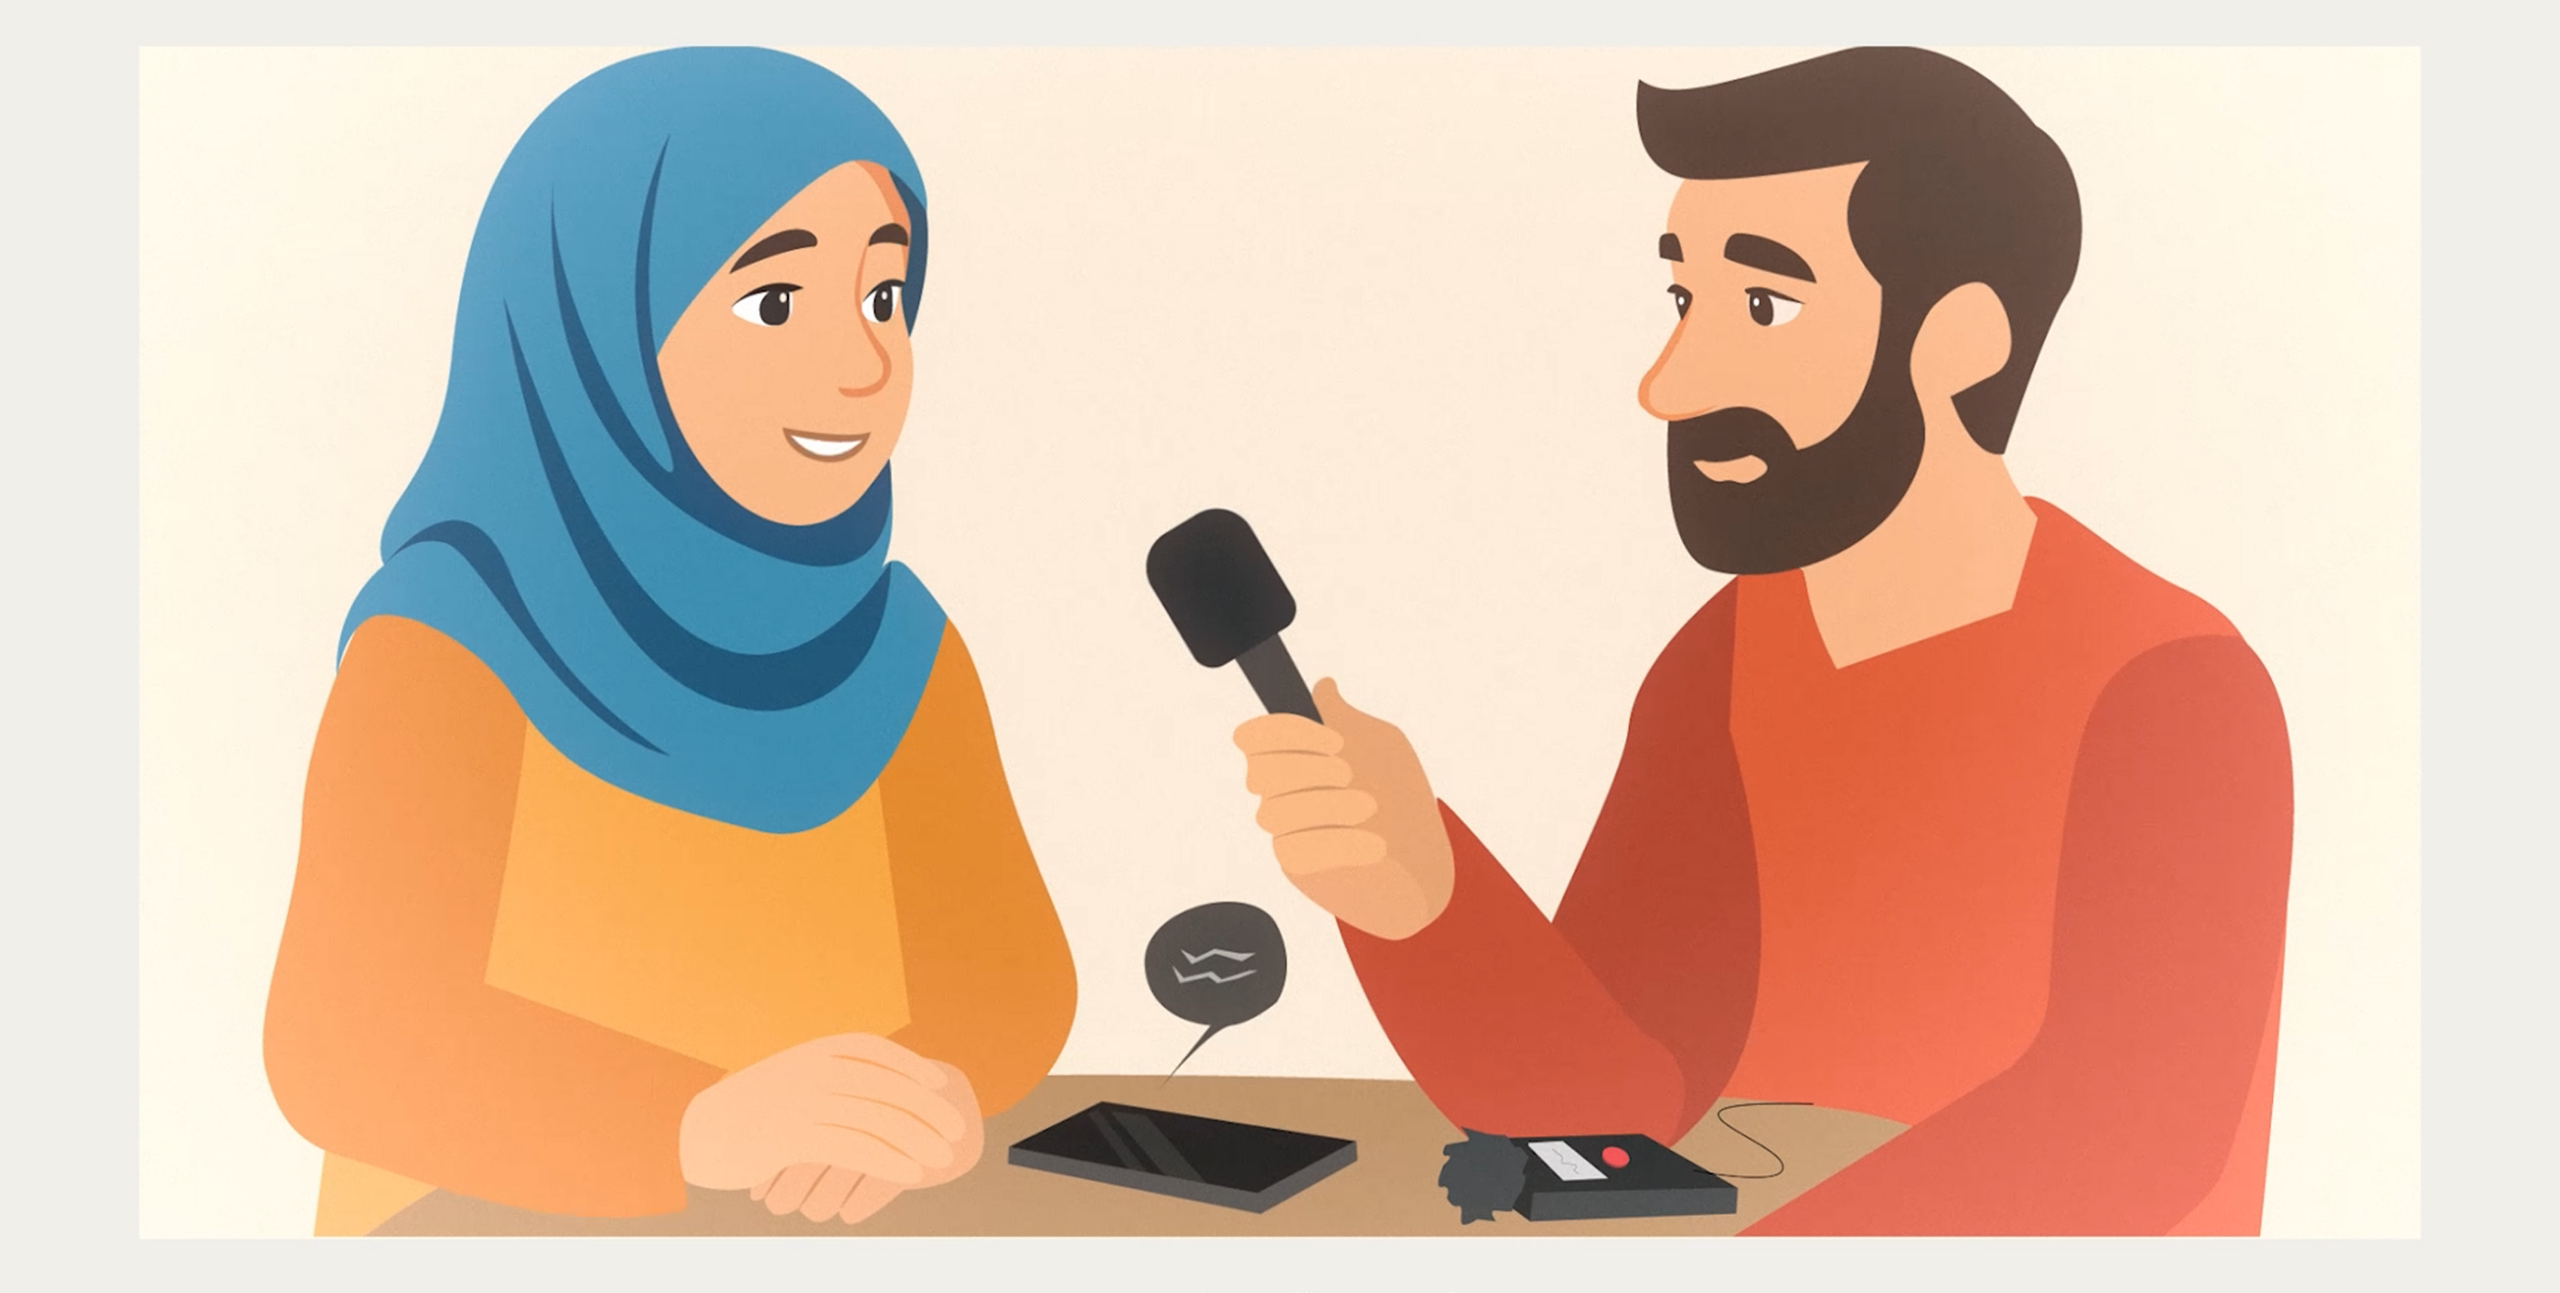
Consent forms for people with limited previous education
In this project, simple, multilingual videos were created to help refugees better understand and give informed consent to research participation.
-
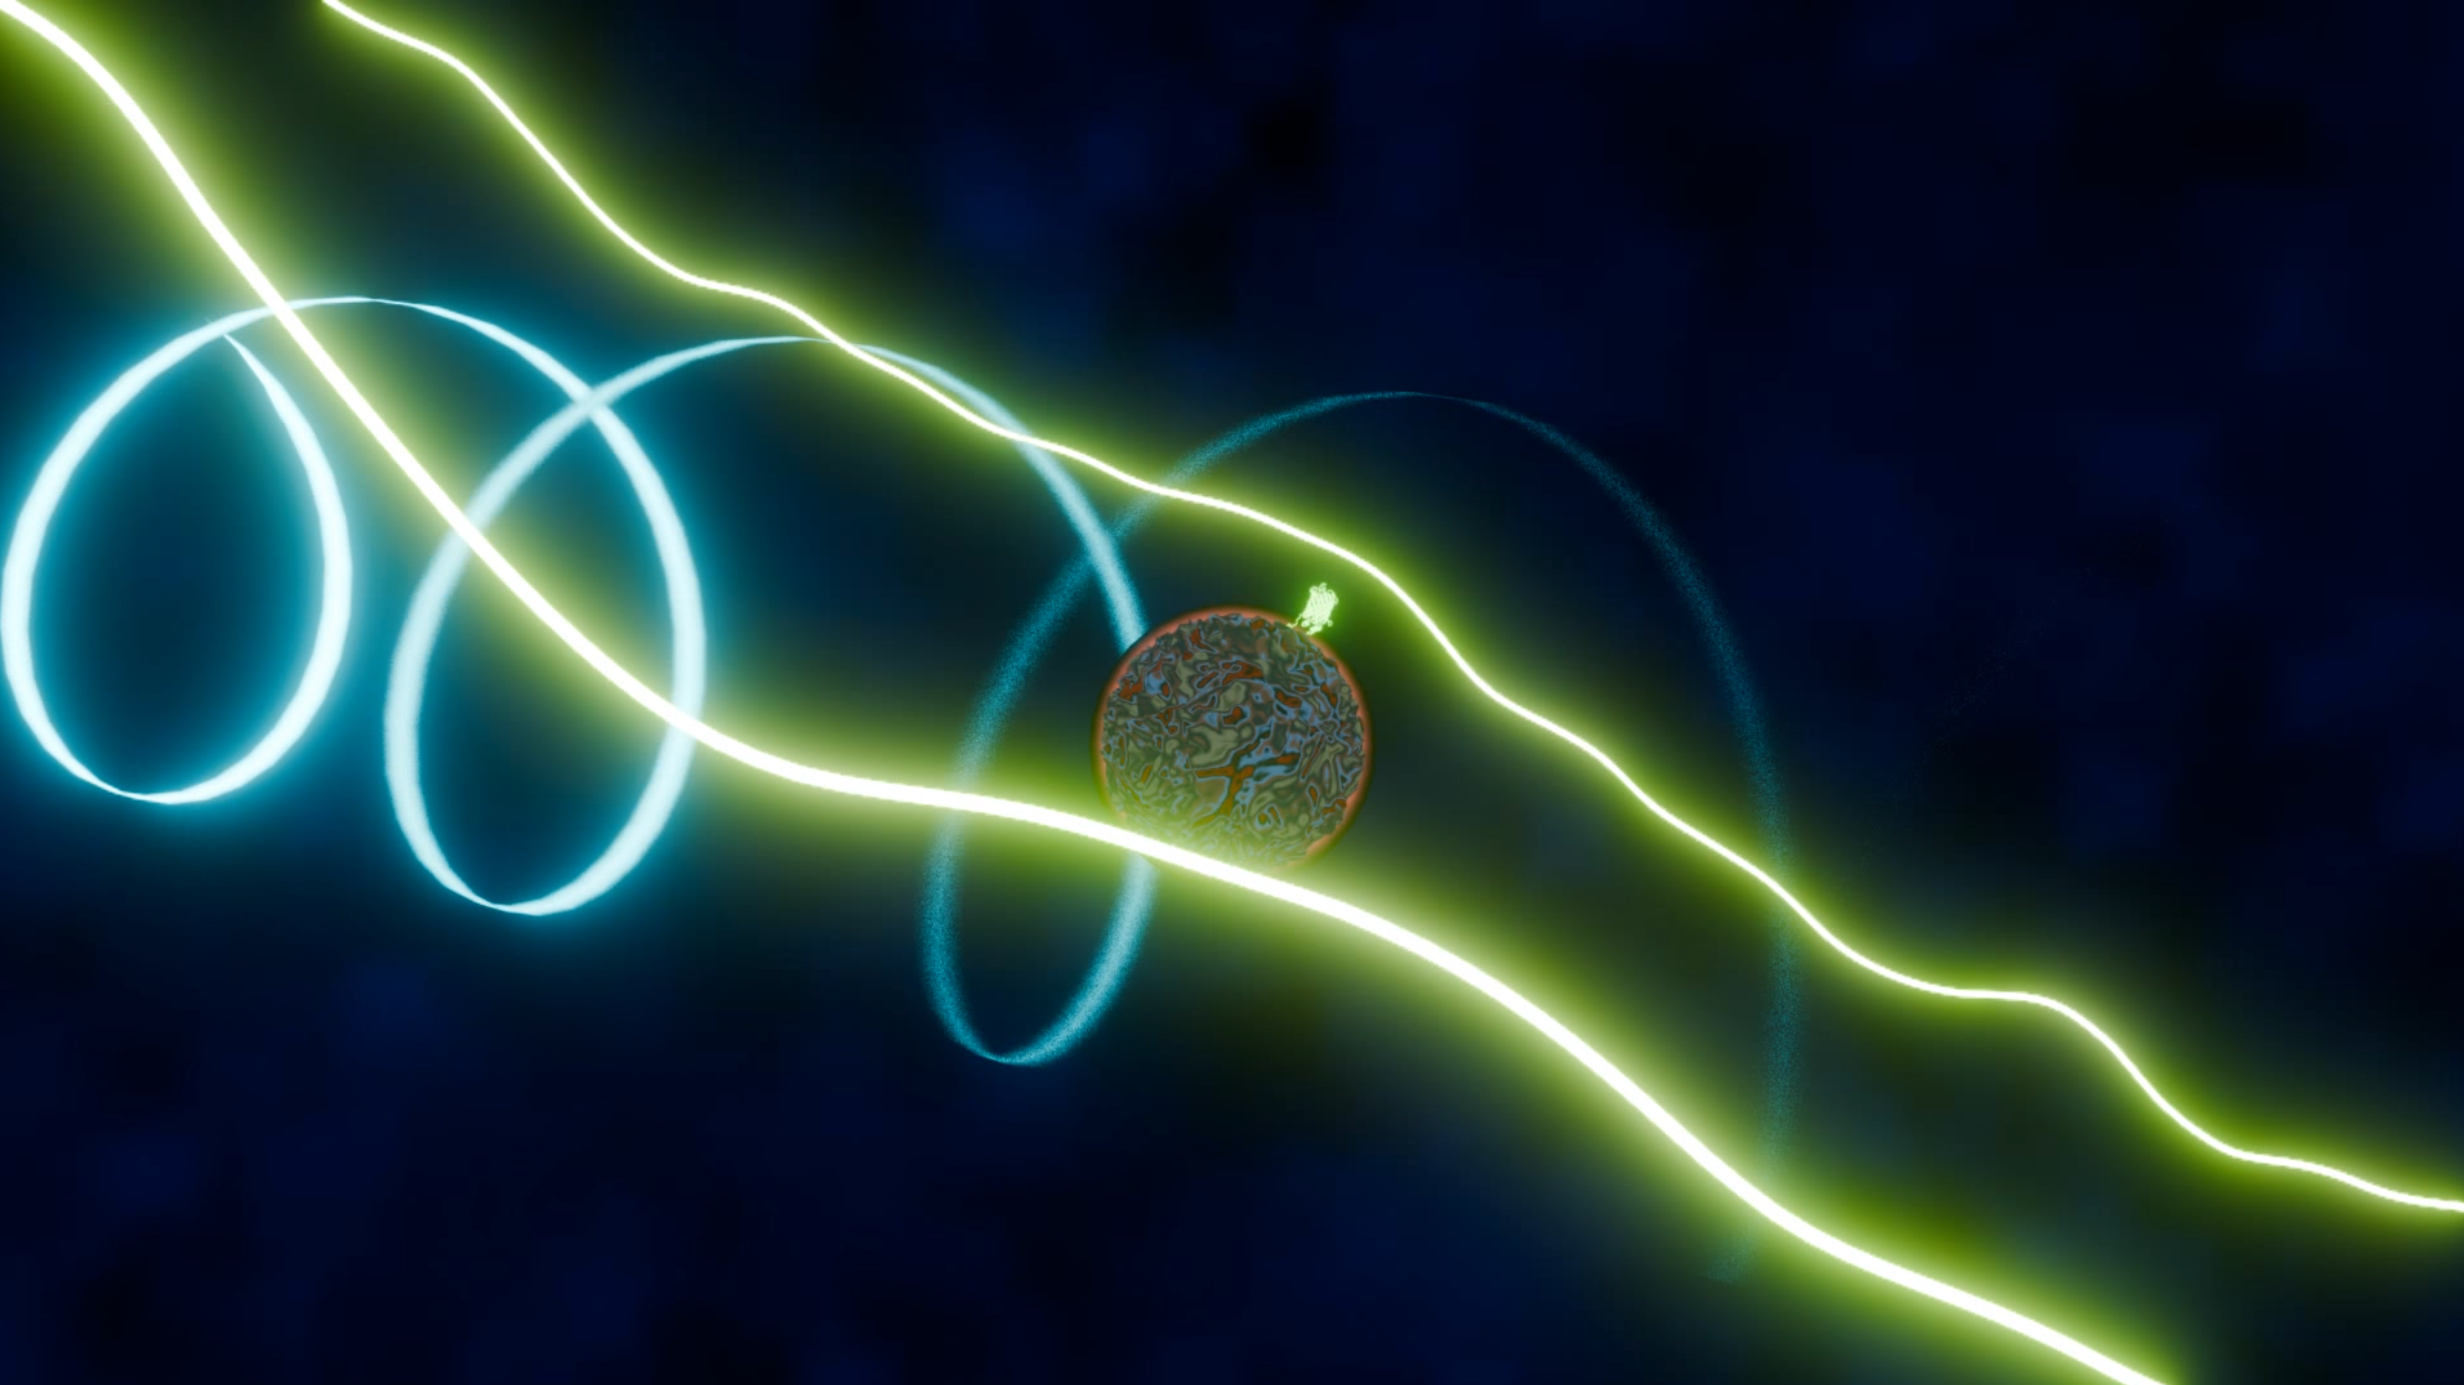
Visualizing physical interactions of molecules in macromolecular scale
The research group led by Ilaria Testa (KTH, SciLife Lab) has developed a novel method for measuring the rotation of molecules in a solution.
-
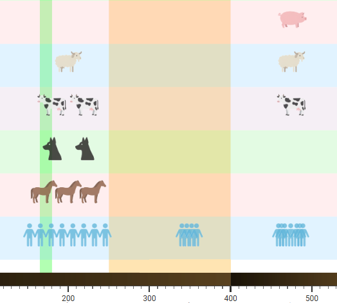
Human Timeline
Human-Timeline is an interactive React and PlotlyJS application that visualizes the coevolution of human culture , diverse life species and environmental factors across vast timescales. Inspired by SIMILE’s TimePlot and TimeLine patterns, it combines stacked timelines with dual-axis plots so users can see discrete events, continuous measurements, and contextual periods in one place.
-
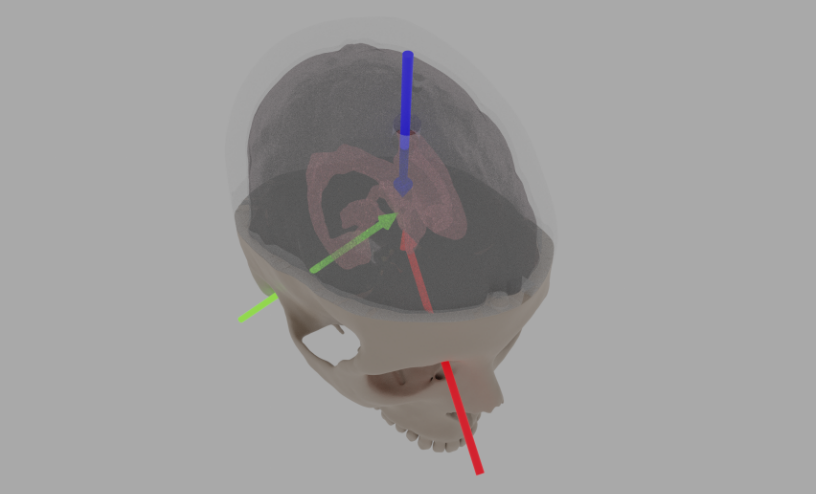
3D Modeling for simulated ventricular surgery
Brain surgery requires extreme precision, which makes realistic training essential. This project was created to improve practice conditions for a procedure where a catheter is inserted into the brain’s ventricles to relieve fluid buildup. The training setup uses a 3D‑printed skull and a Jello‑based artificial brain that mimics real tissue. InfraVis contributed by redesigning and…
-
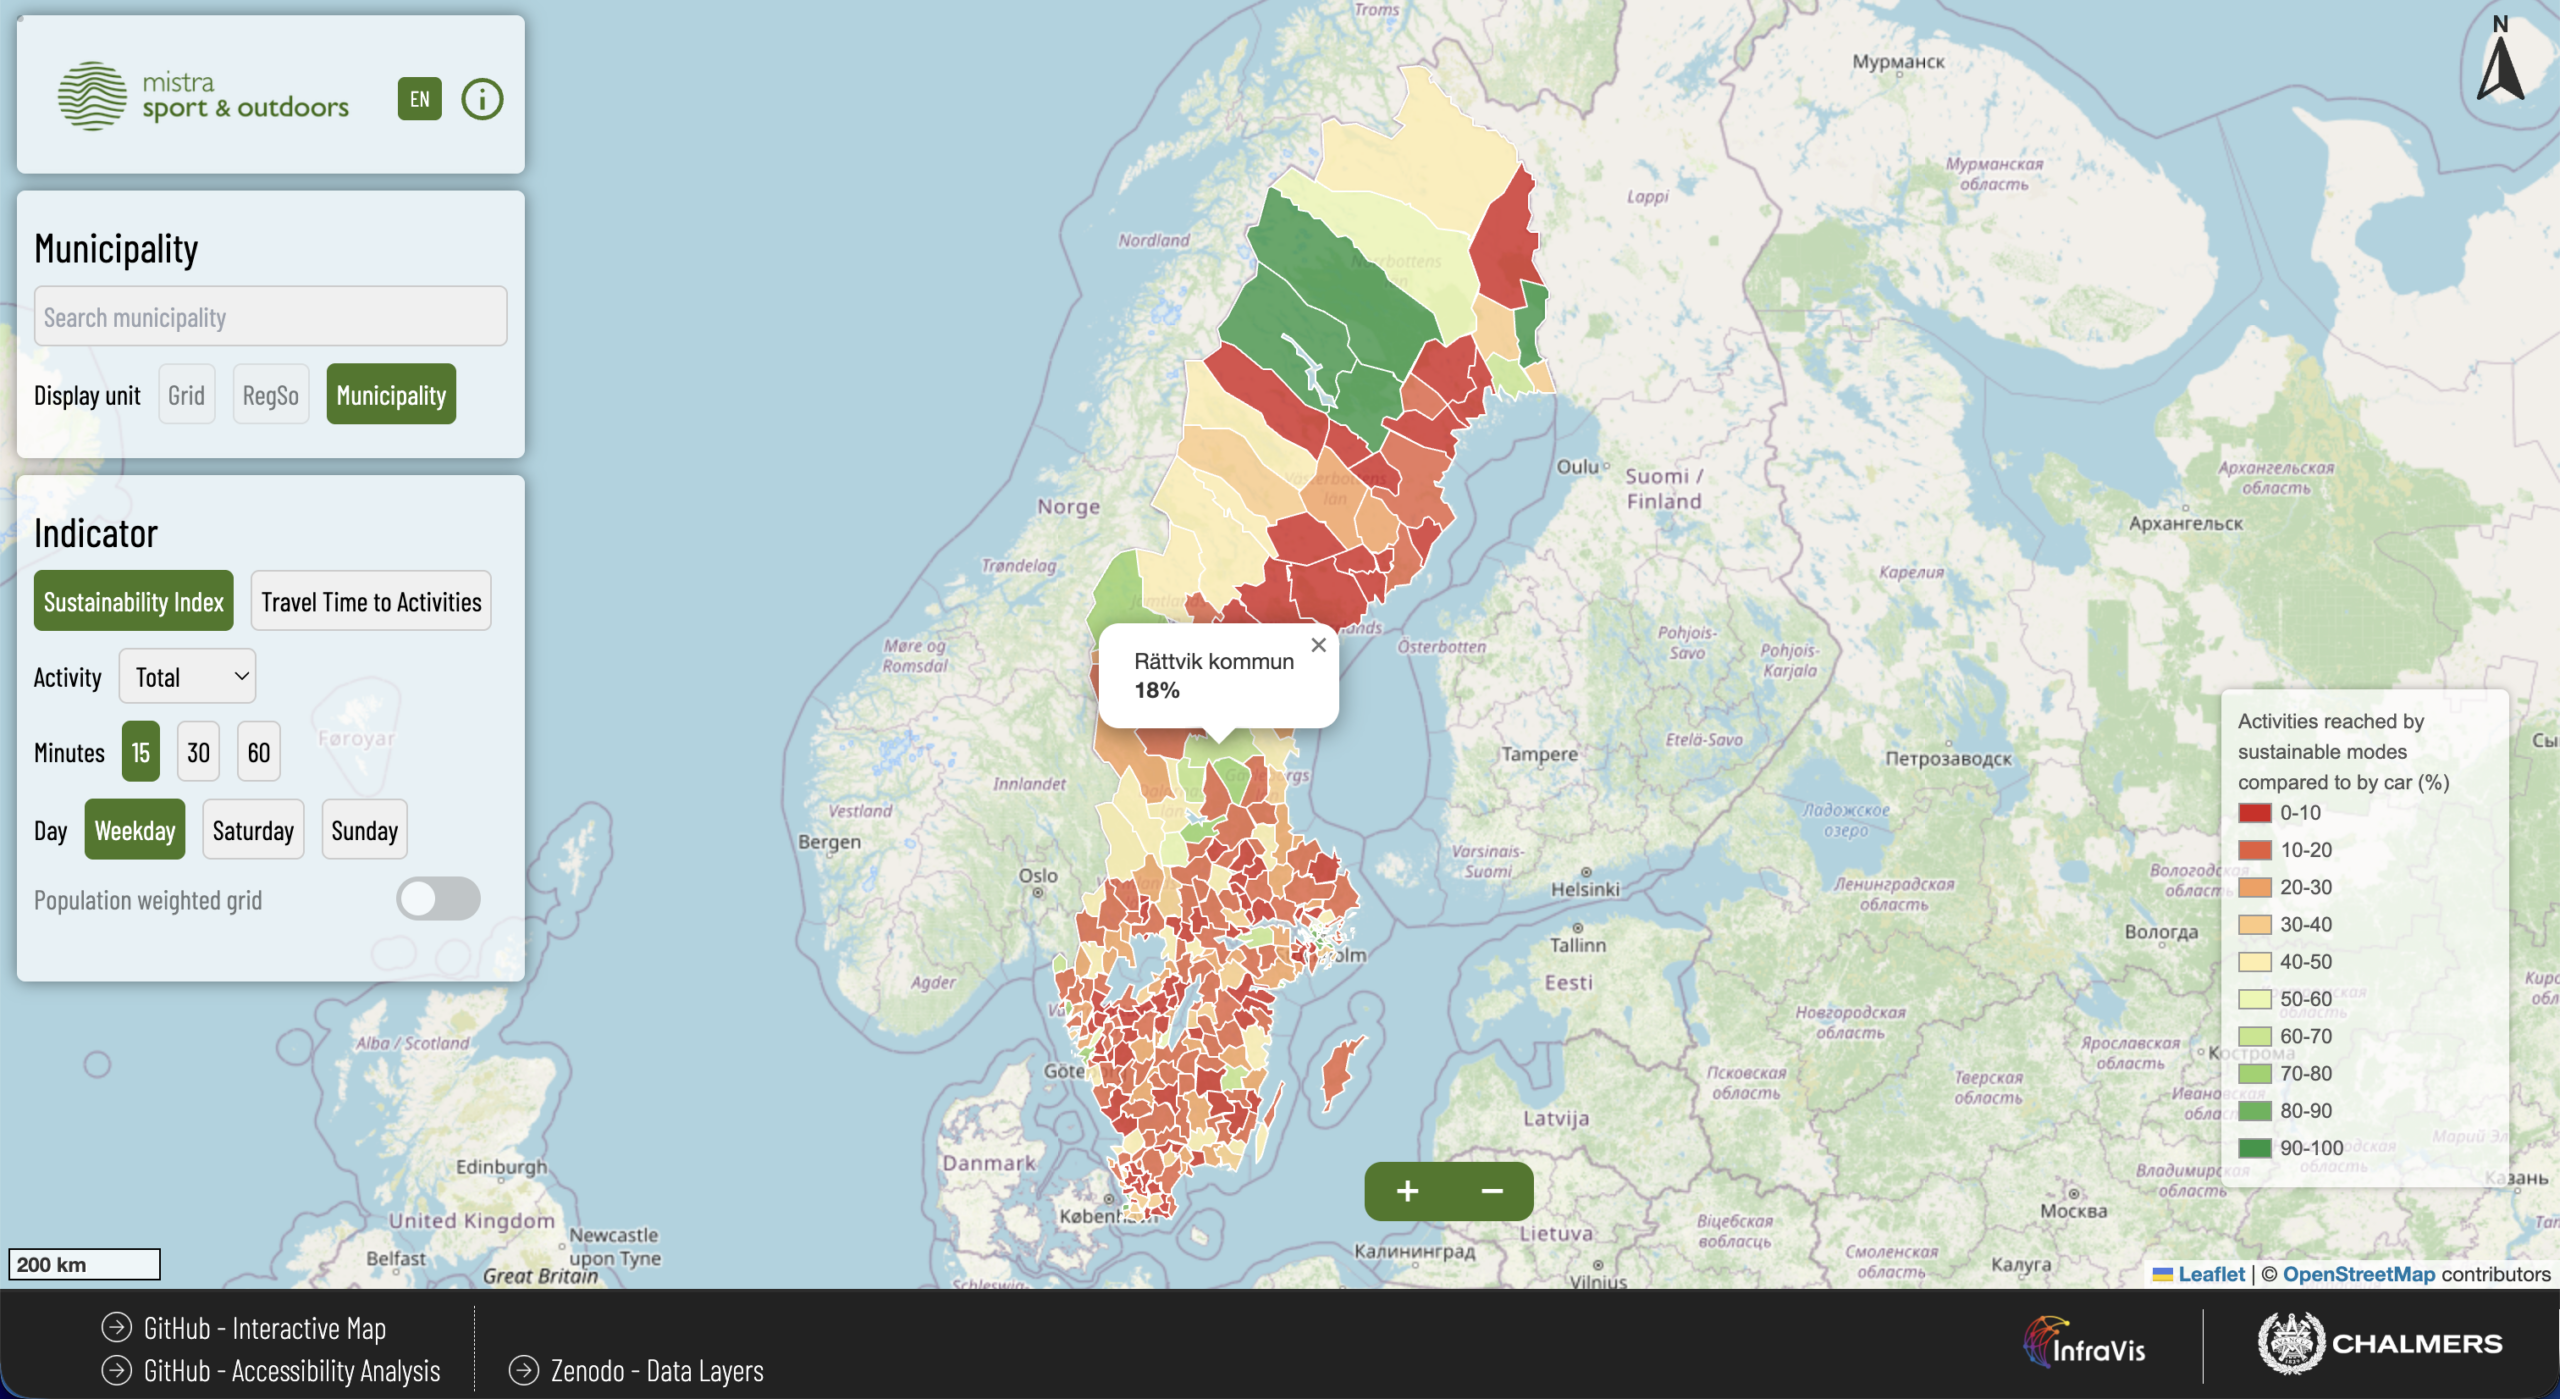
Sport and Outdoors Sustainable Accessibility Map
Welcome to the Sport and Outdoors Sustainable Accessibility Map – an innovative tool designed to explore, help understand and improve sustainable accessibility to sports and outdoor activities throughout Sweden.
-
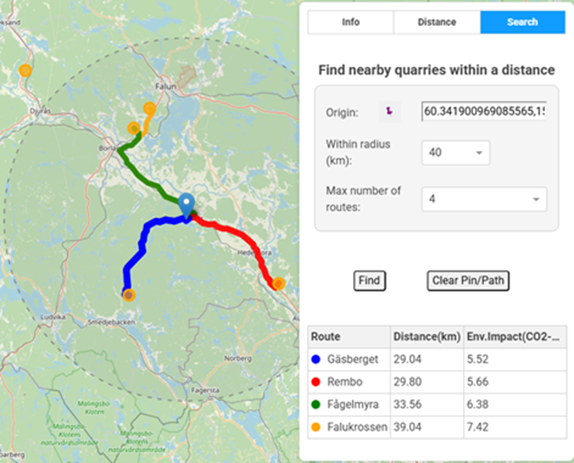
GIS Benchmark Tool for Environmental Impact of Quarries and Mining Industry
QuarryGIS is an interactive environmental visualization and benchmarking tool built to make quarry and construction sector impacts tangible for producers, clients, and planners.
-
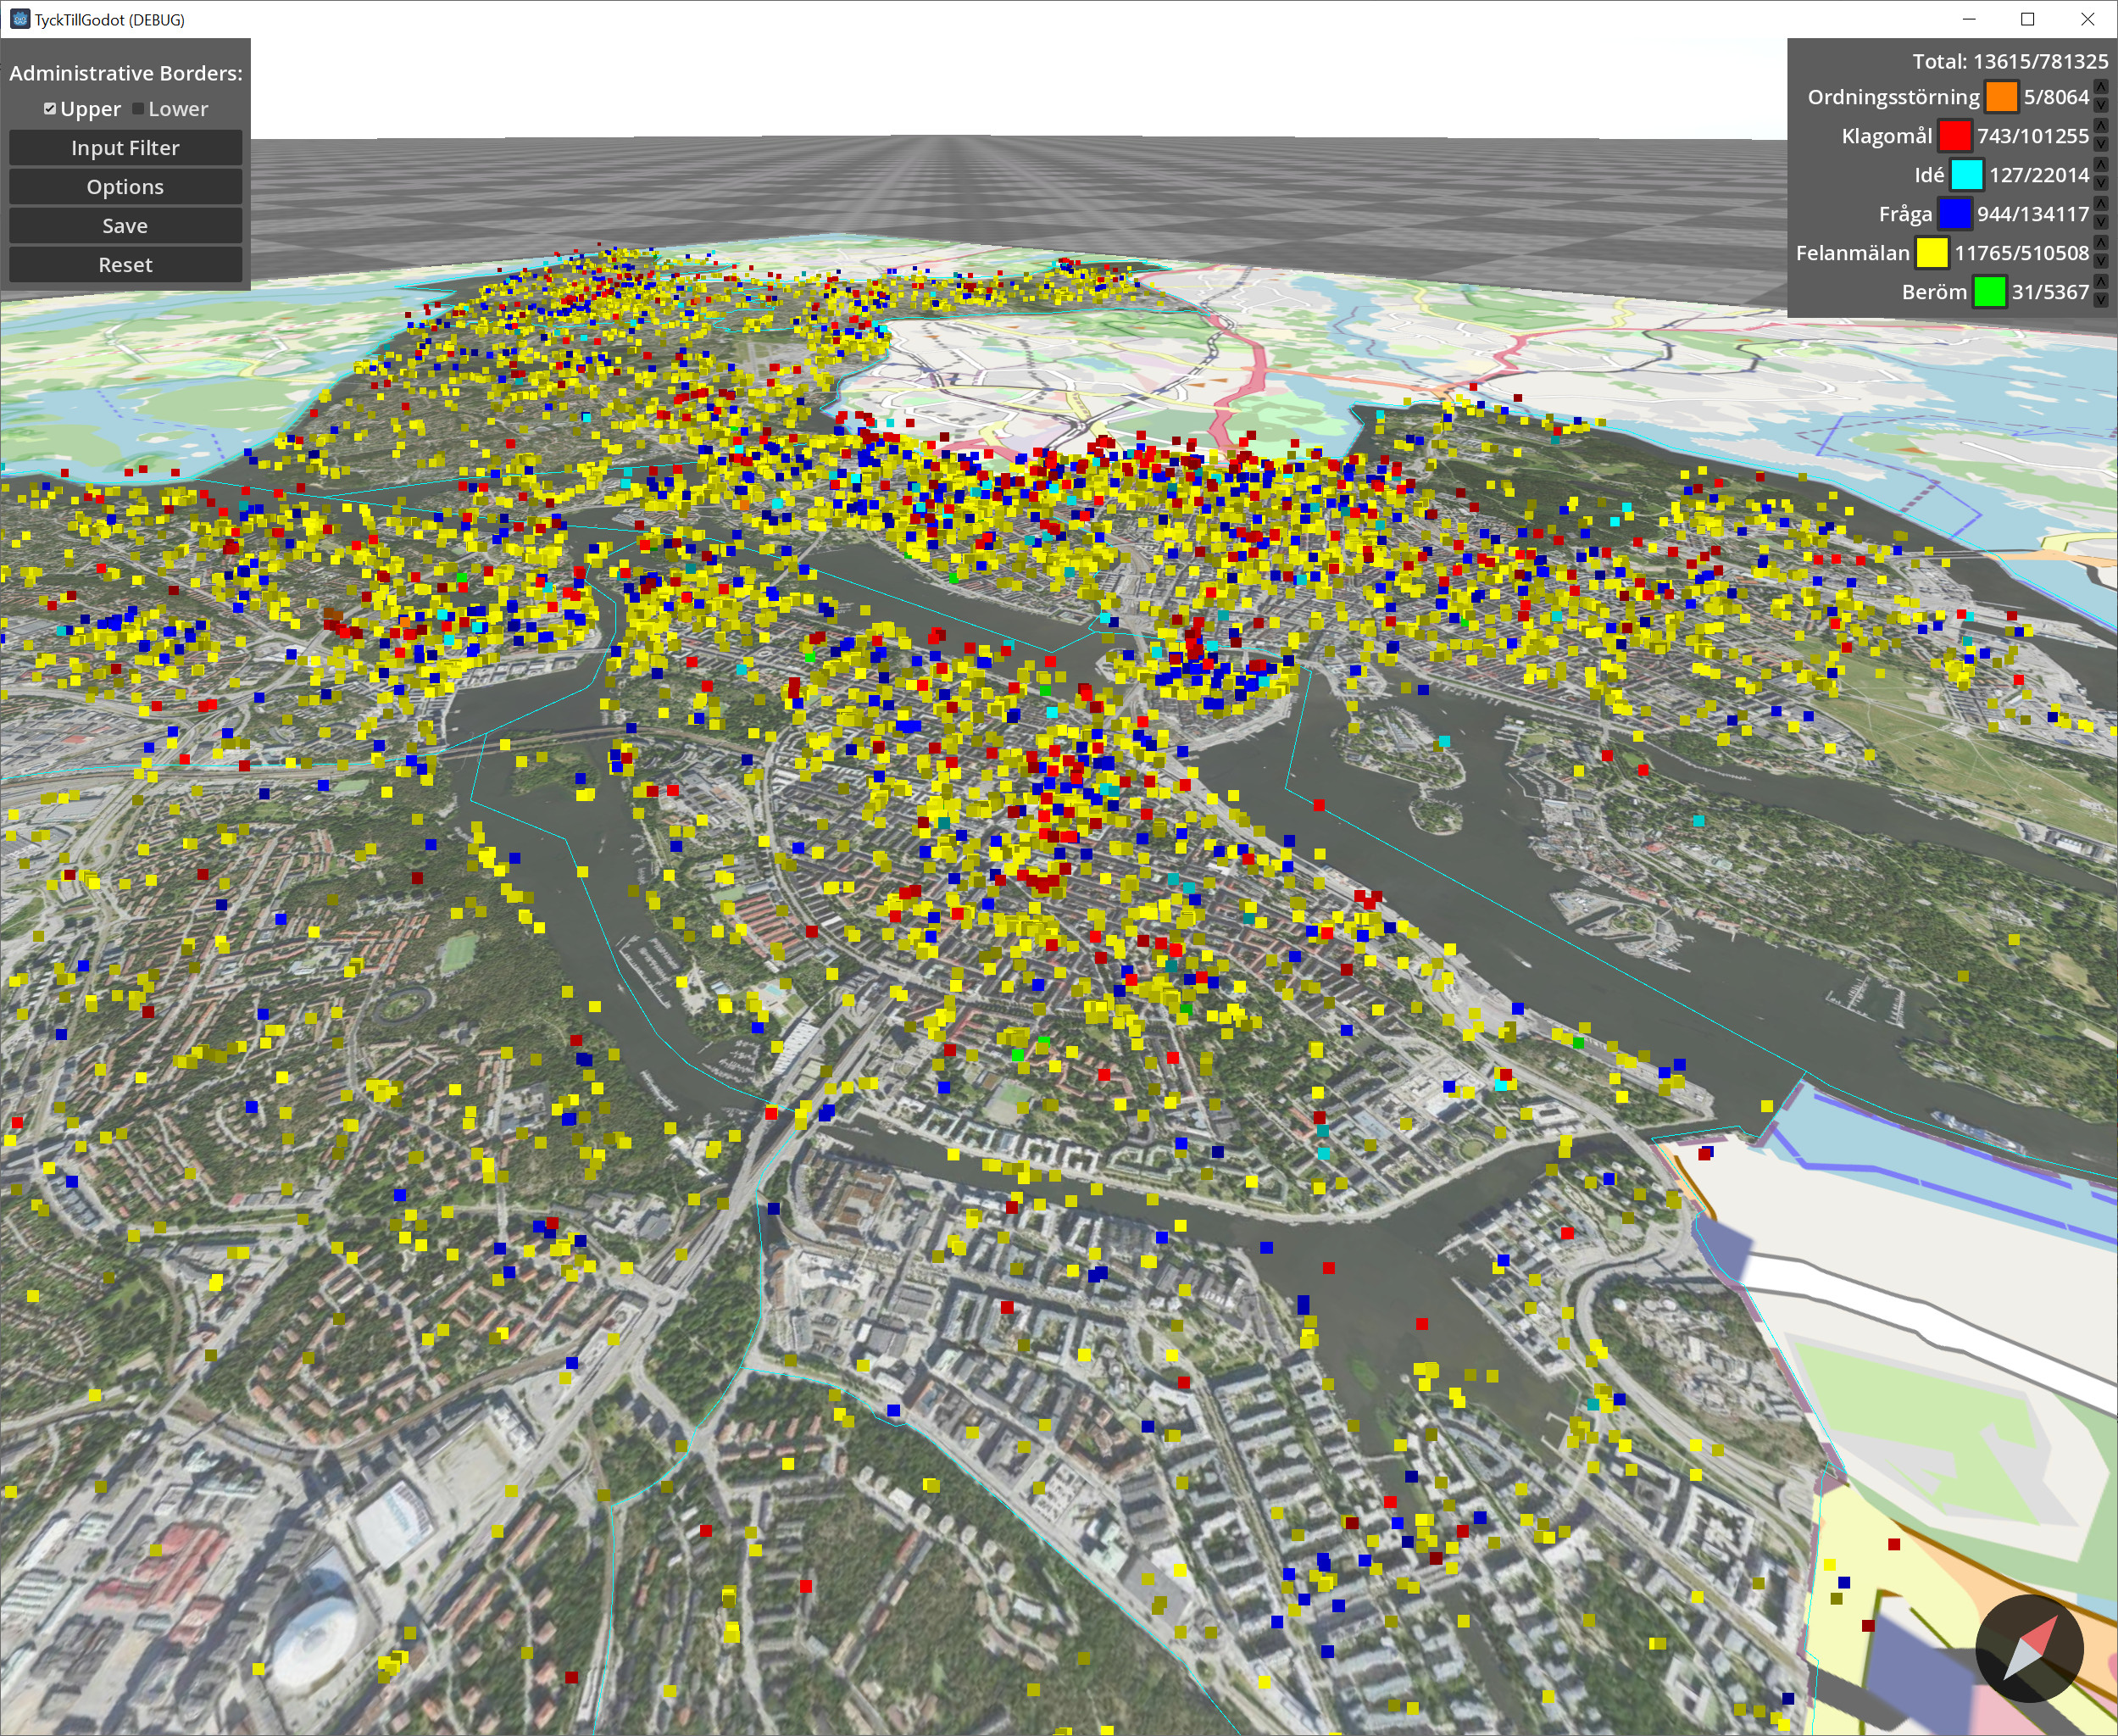
Interactive visualization of crowd sourced urban data from Tyck Till
This project focused on crowd sourced urban data collected from Tyck Till an app developed by Stockholms Stad where users can leave feedback and report errors in the city. The data contains approximately 800 000 georeferenced reports in various categories. The goal of this project was to facilitate interactive exploration of this data through filtering and…
-
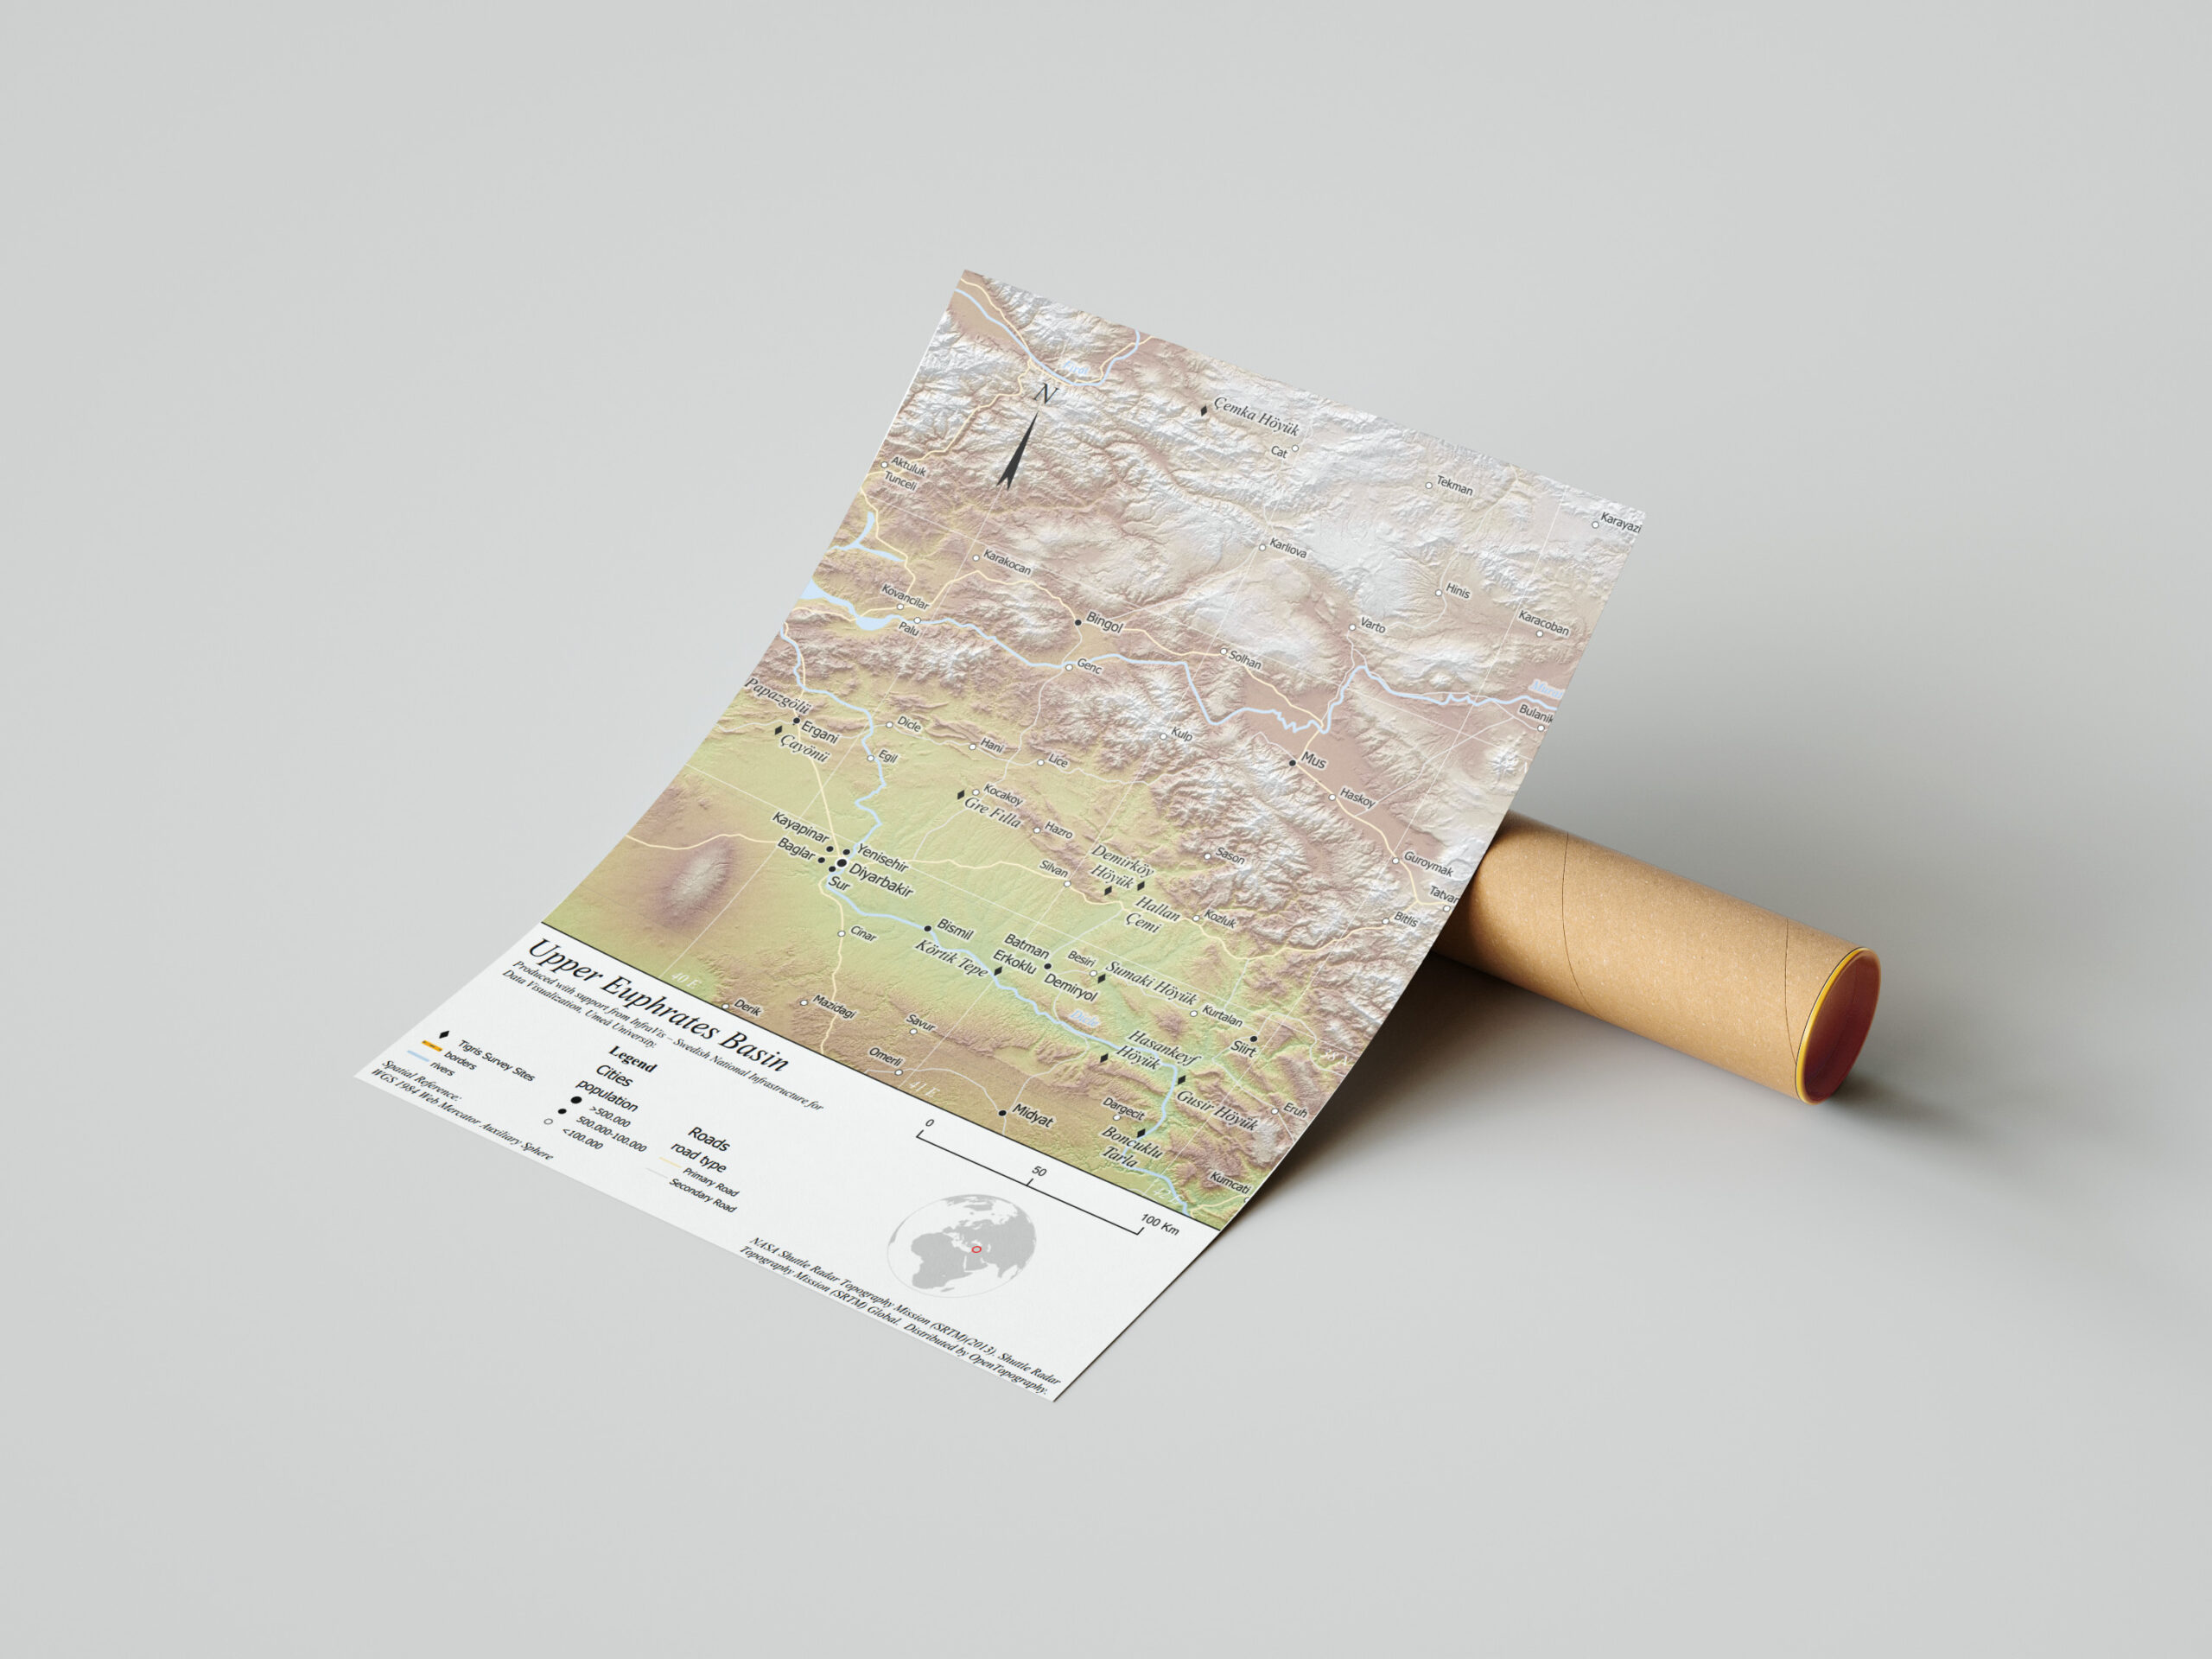
GIS visualization of archaeological sites in the upper Tigris and Euphrates River basins
The project produced GIS-based maps and diagrams to visualize archaeological sites and material culture, highlighting the regional shift from hunting-gathering to farming. It integrates environmental and archaeological data to show patterns of human–environment interaction across multiple case study areas and their chronological development.
-
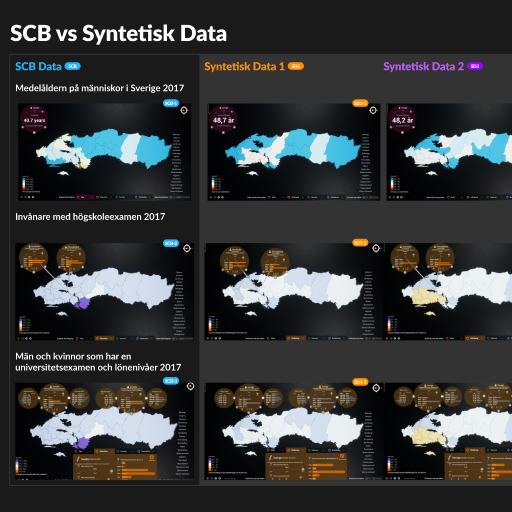
Synthetic Sweden – Exploring applications and limitations of synthetic demographic data
The goal of this project was to introduce synthetic demographic data to a public audience through an extension of the existing “Sweden-in-Numbers” installation.
-
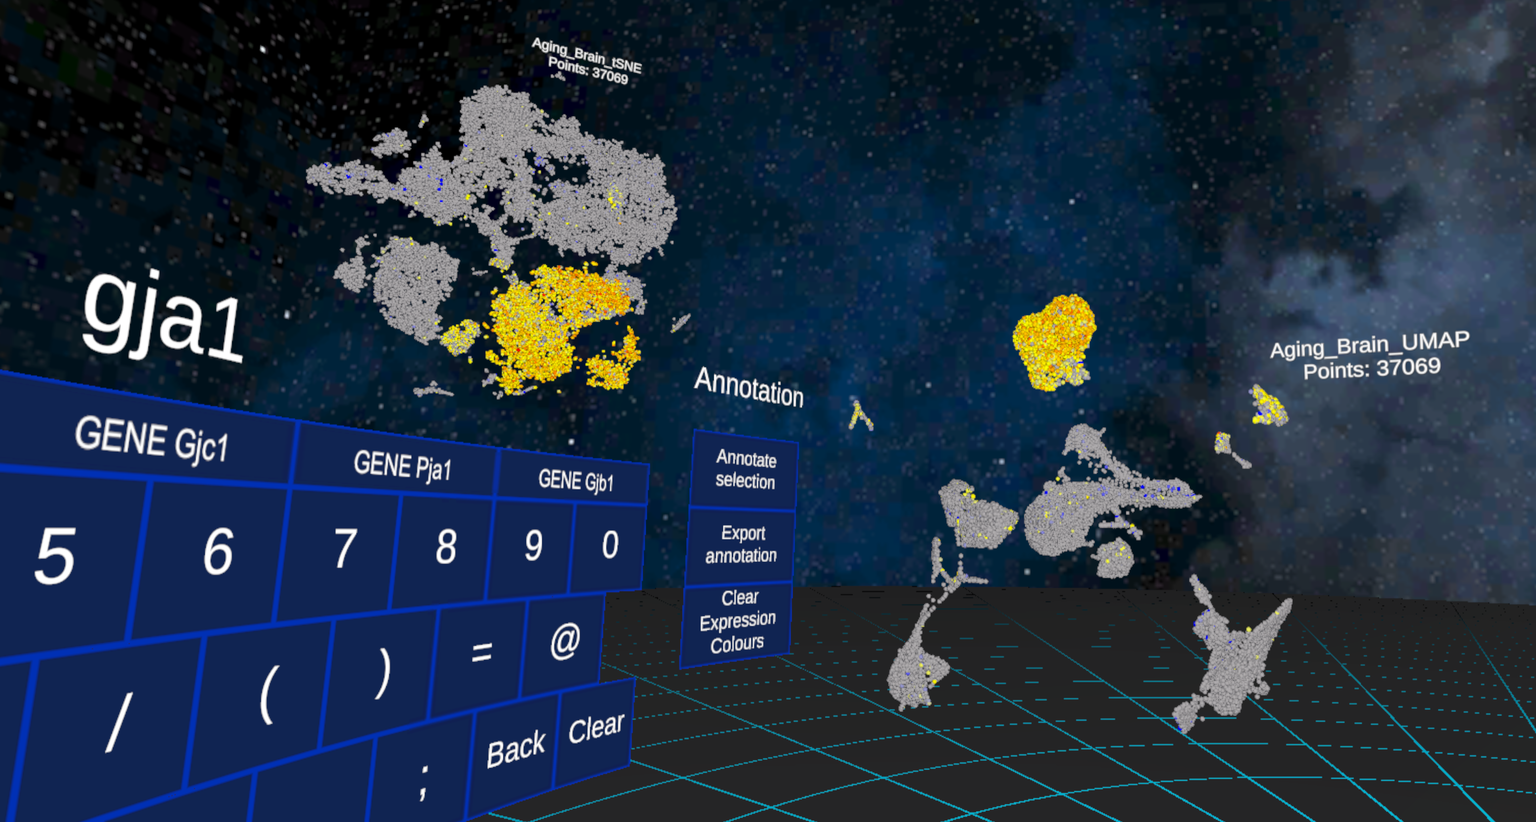
GenomeLens
The aim of the project is to produce the novel interactive tool “GenomeLens”, that uses genome sequencing data to visualize genetic variation along chromosomes within and between populations.
-
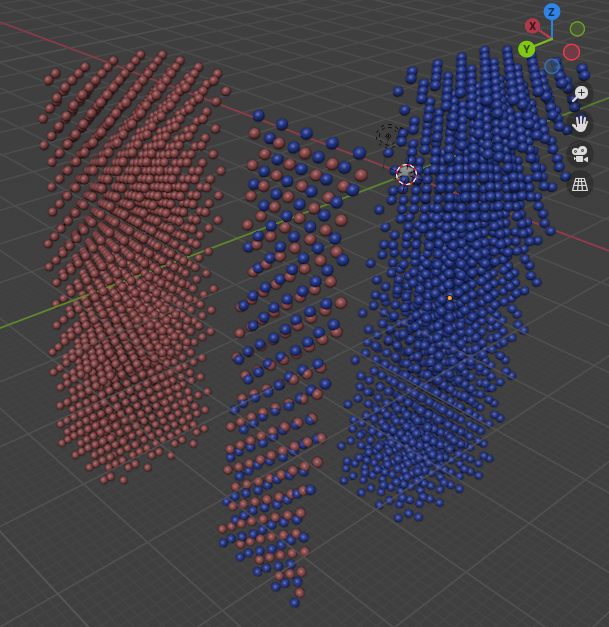
Visualization of incommensurately modulated structures on example of allotropes of bromine at high pressures
This project developed a specialized 3D visualization tool to explore how halogen crystal structures transform under extreme pressure, particularly focusing on incommensurately modulated structures that emerge during molecular dissociation. By enabling interactive visualization of complex atomic configurations and transitions, the tool helps researchers interpret structural phase changes that are otherwise difficult to analyze using conventional…
-
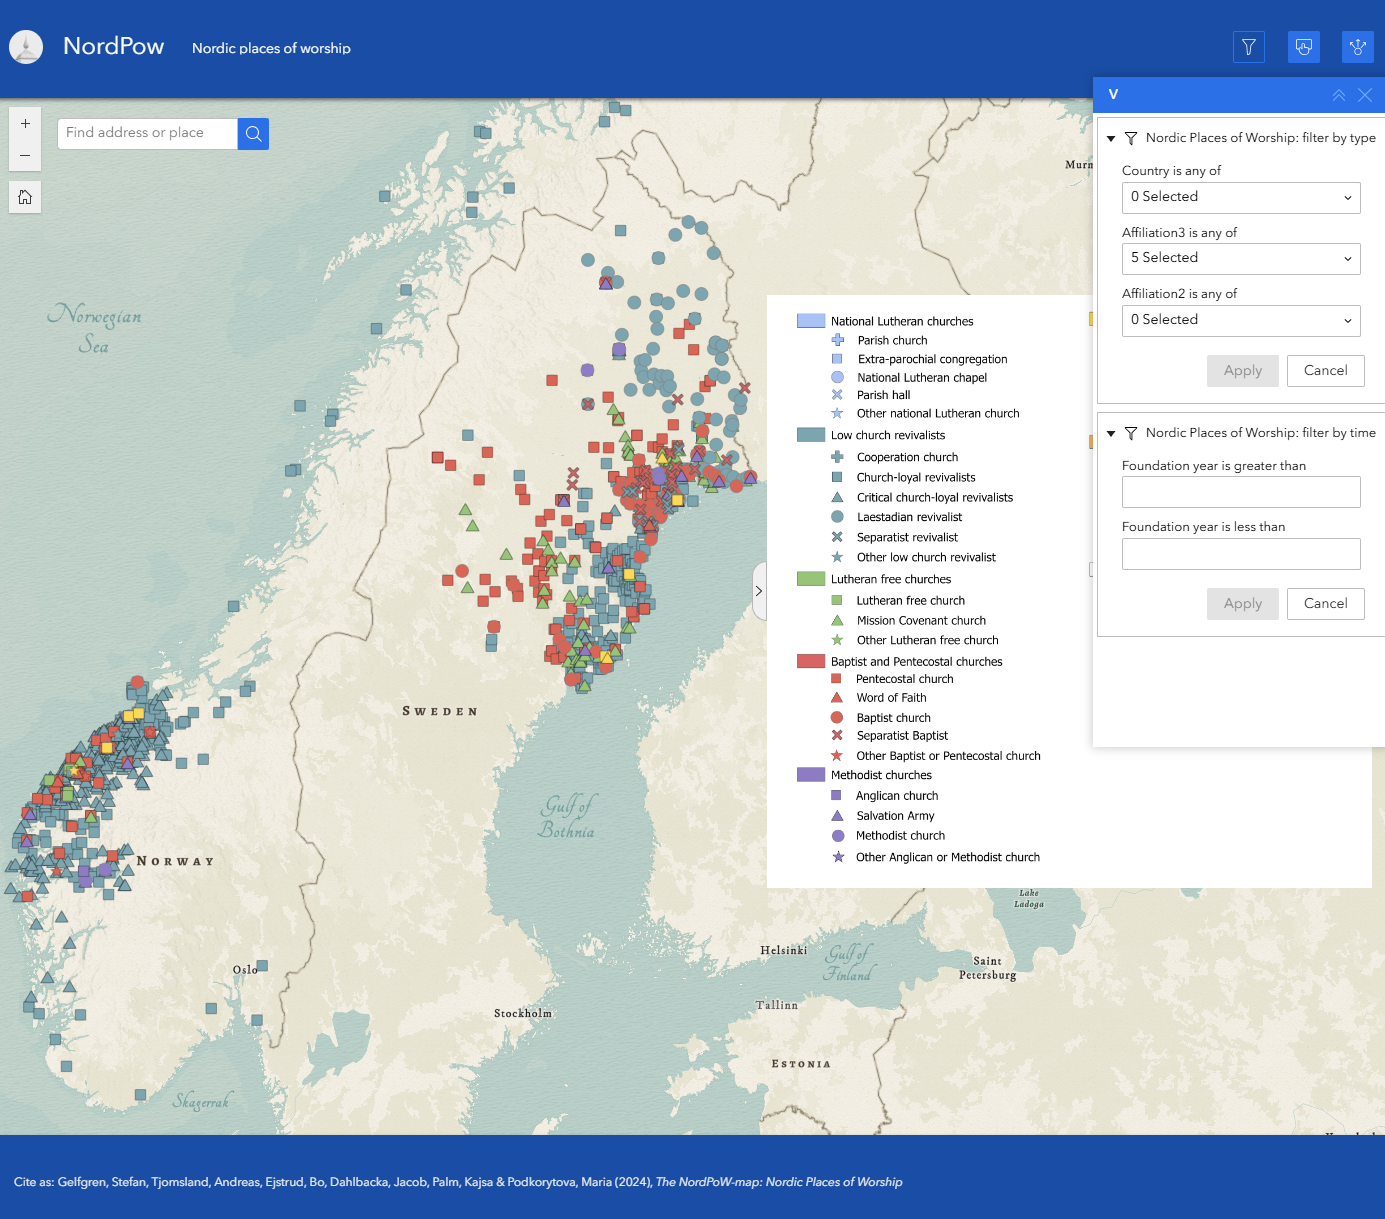
NordPow
The project’s primary objective is to create a comprehensive Nordic resource for researching churches and prayer houses. At the same time, it seeks to document and preserve the rich historical heritage associated with these religious sites across the Nordic region. The primary audience for this initiative is researchers specializing in religious studies. Currently, the dataset…
-
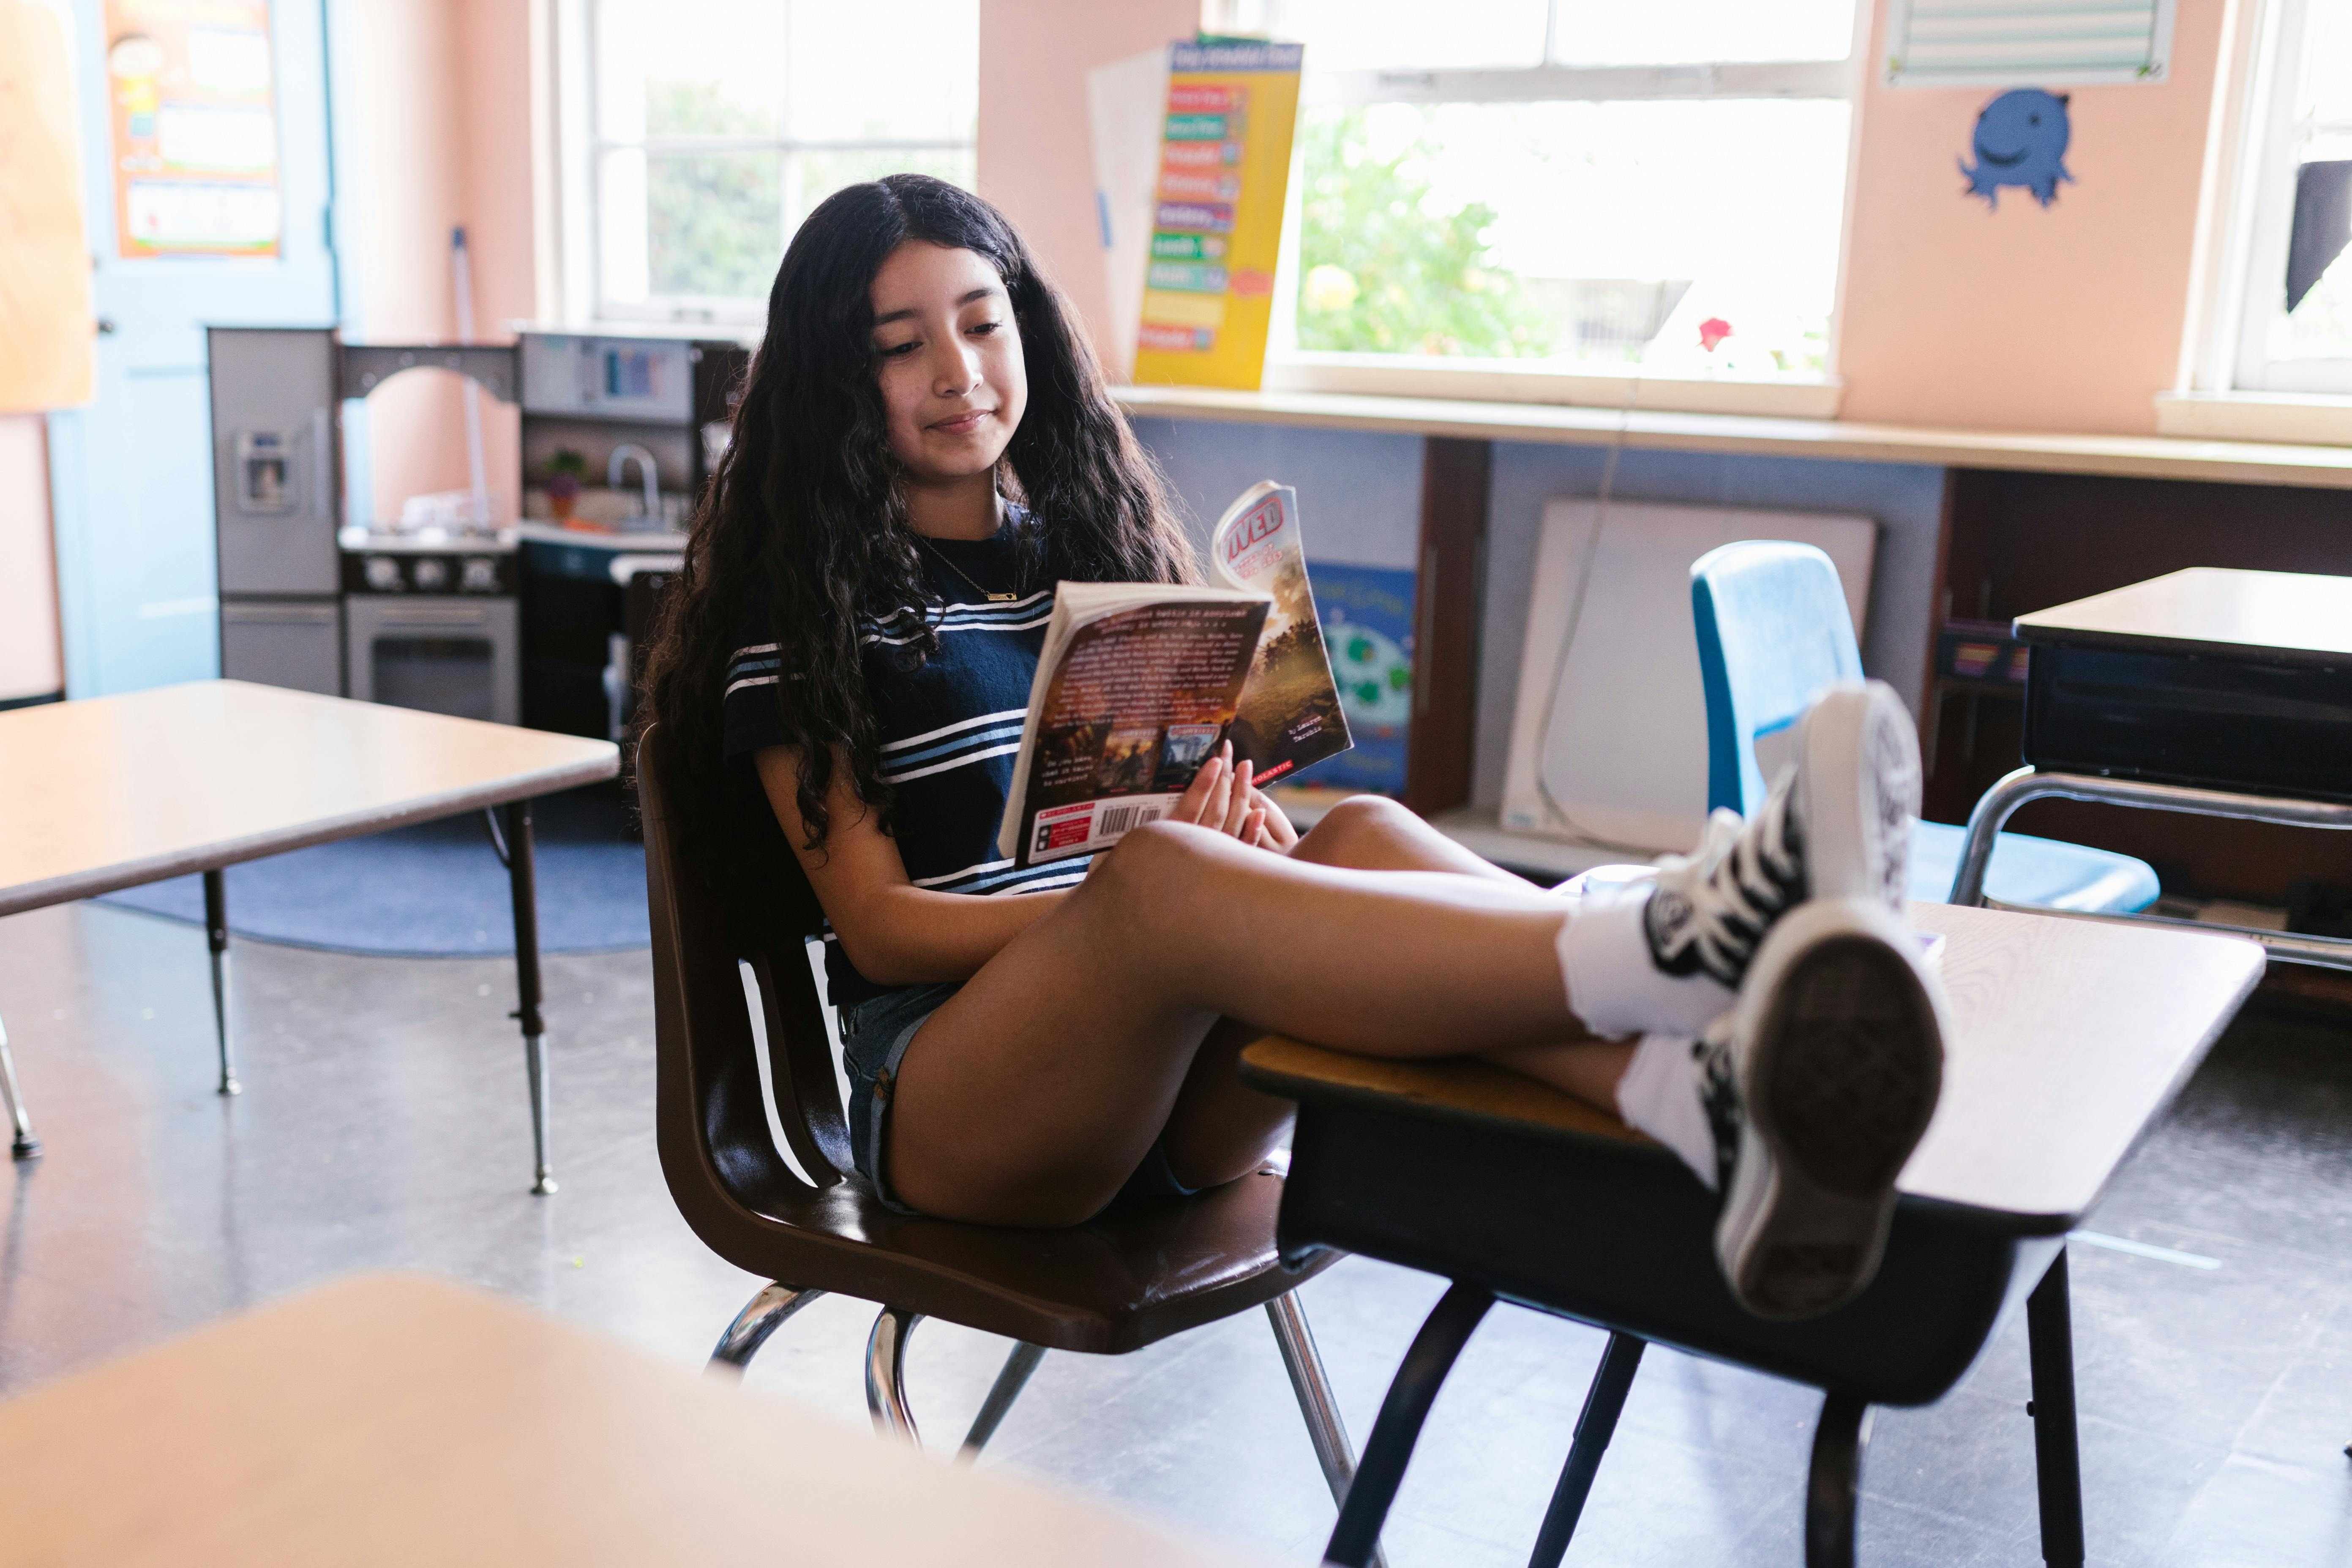
Visualizing Literacy of Children in School
This project explores ways of visualizing data concerning the literacy metrics of elementary school children in Sweden, collected using a sophisticated tool developed for this very purpose.
-
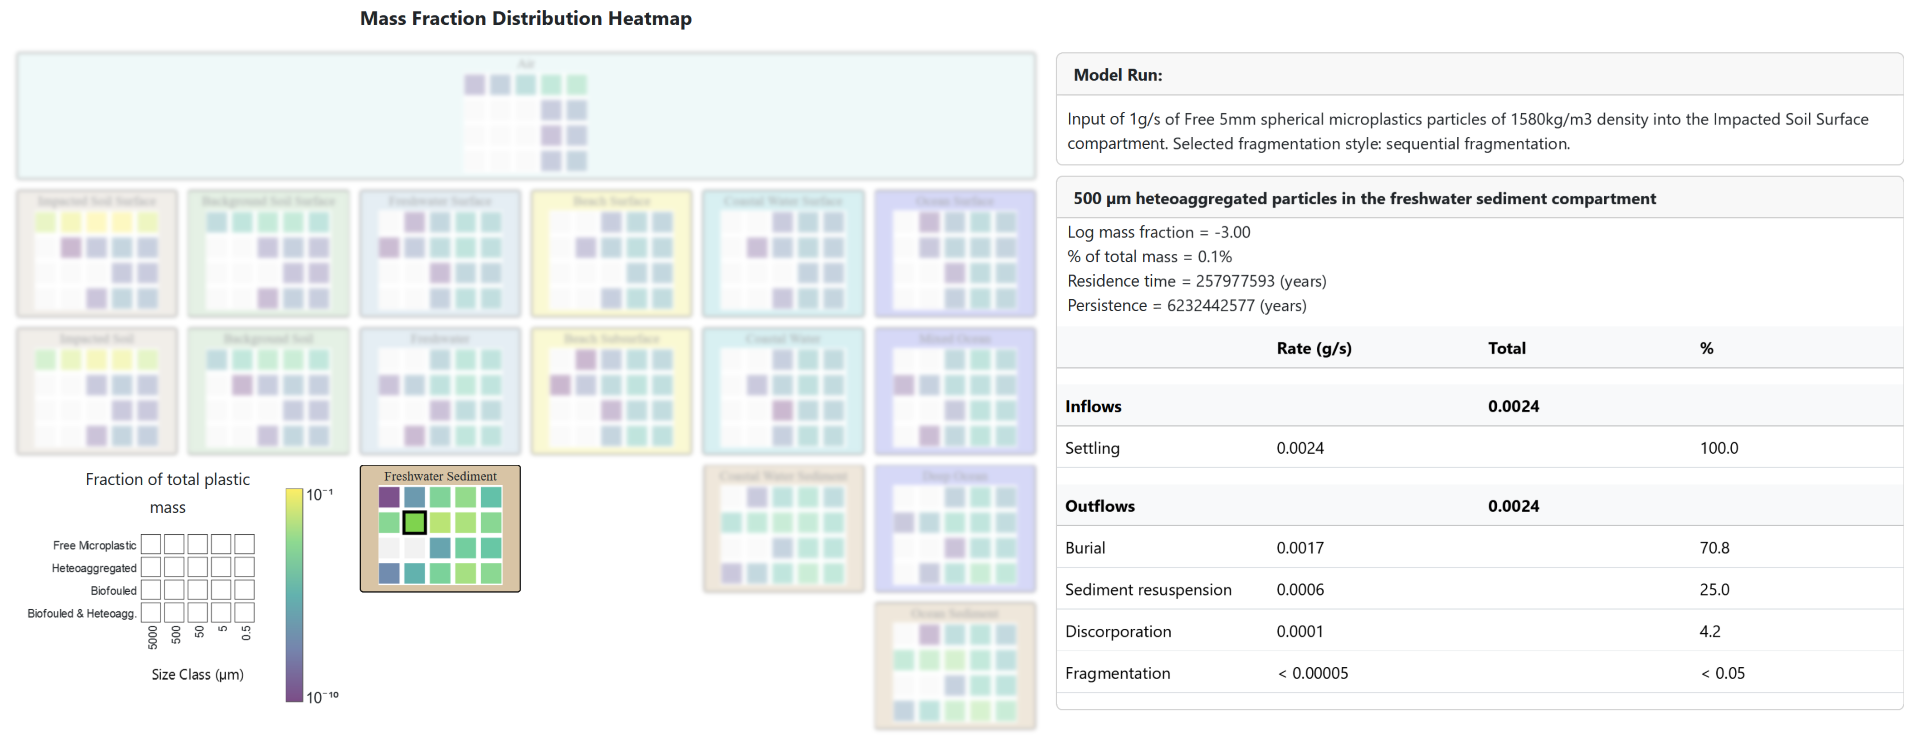
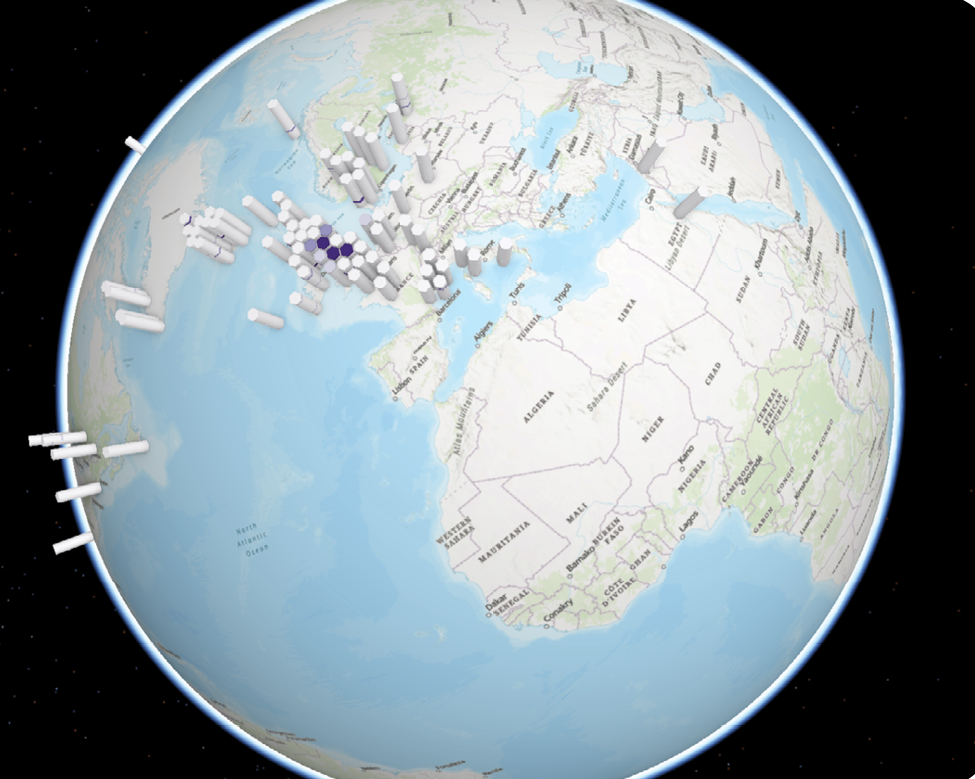
Utopia web app: Study Microplastics Fate And Transport On A Global Scale
Plastic pollution has emerged as a significant environmental concern, drawing increasing attention from the public and government agencies. In recent years, the presence of microplastics in aquatic and terrestrial ecosystems worldwide has become a critical focus of concern.
-
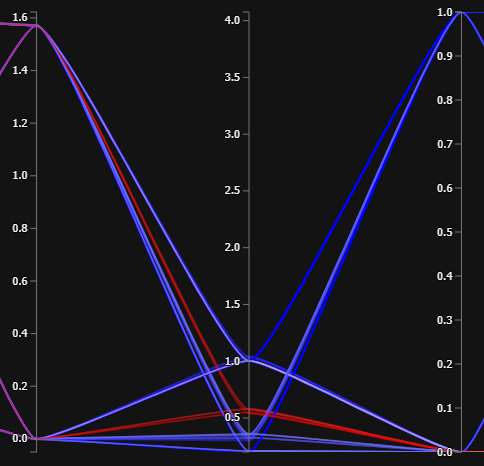
Dynamically Visualizing high-dimensional datasets using parallel coordinates plot
Displaying many dimensions of a dataset simultaneously presents its set of challenges. One way of going about dealing with these challenges is to present each data point, each “row” if you will, as a line across all axes parallel to each other. This project aim to provide a solution for any such dataset.
-
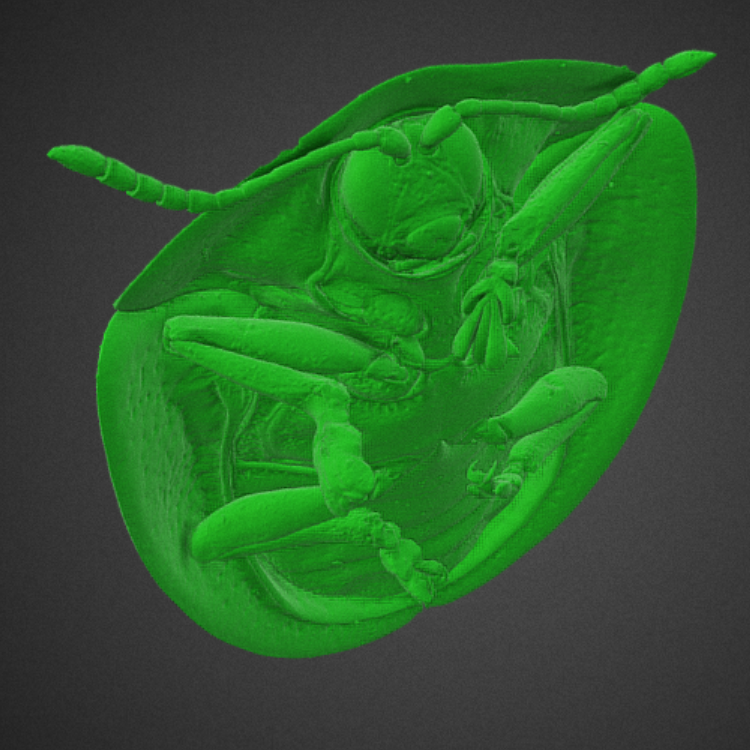
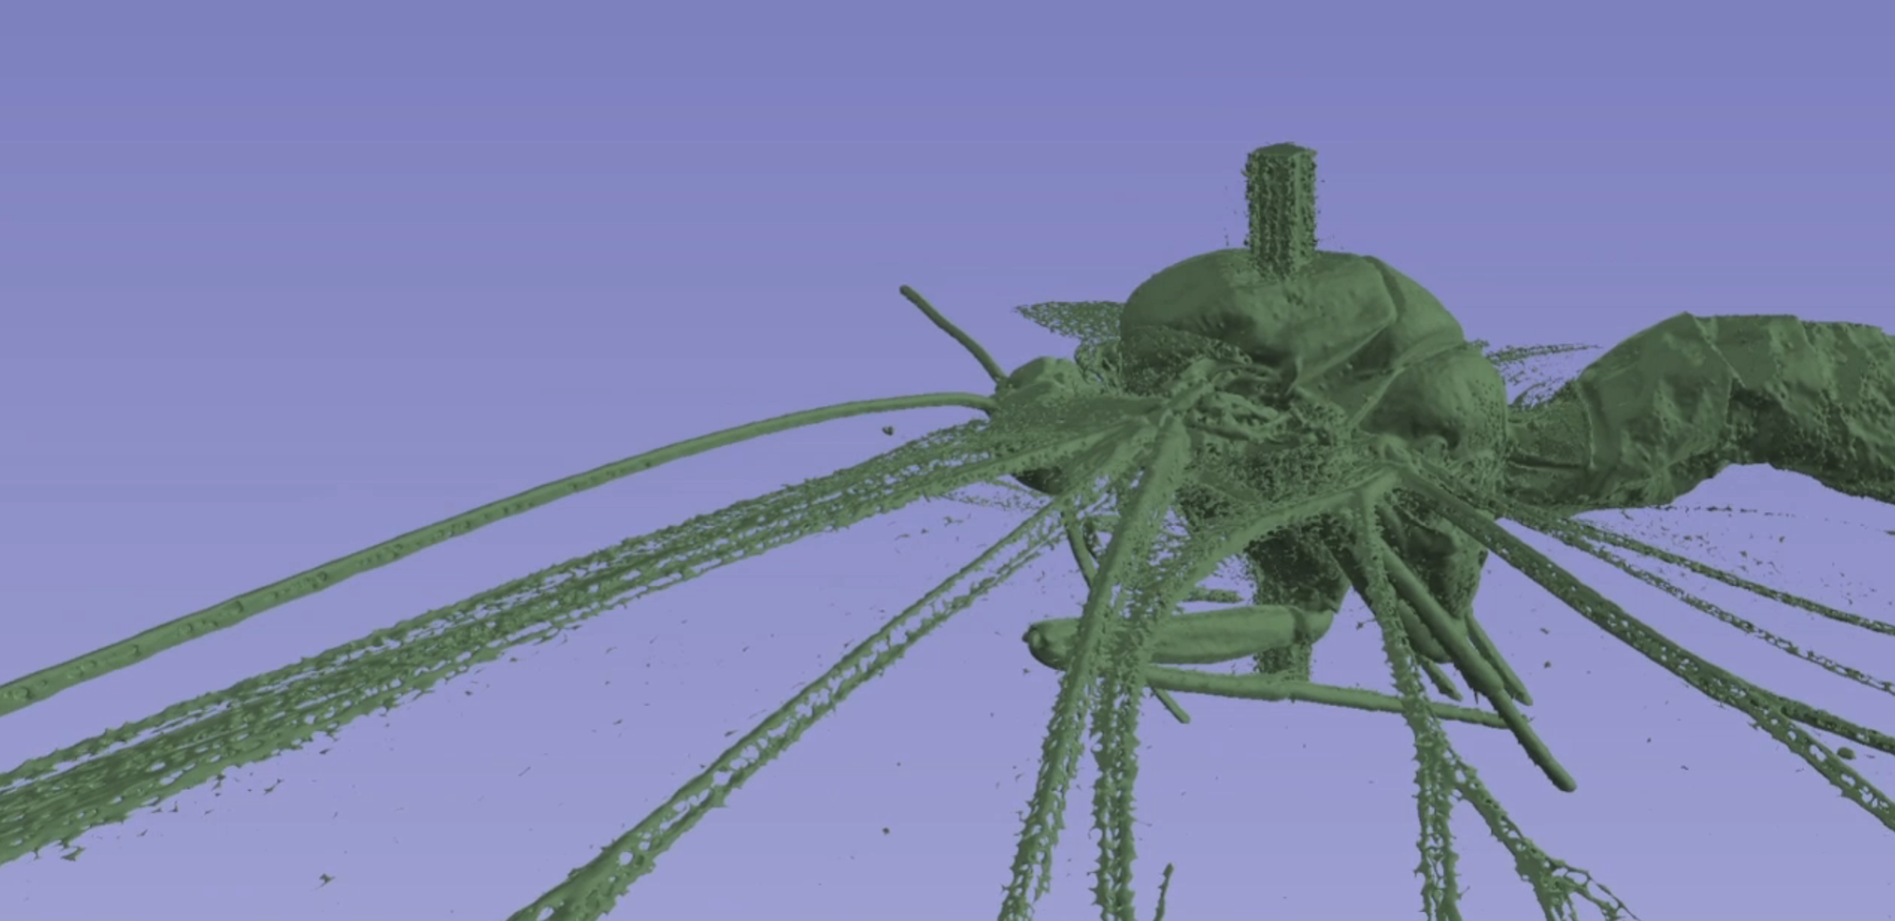
Producing and Rendering a 3D Mesh of Cassida Viridis – Green Tortoise Beetle
This project focused on developing a user-friendly and accessible pipeline for producing 3D models or ‘meshes’ from volumetric datasets, specifically for this case, in the domain of biology.
-
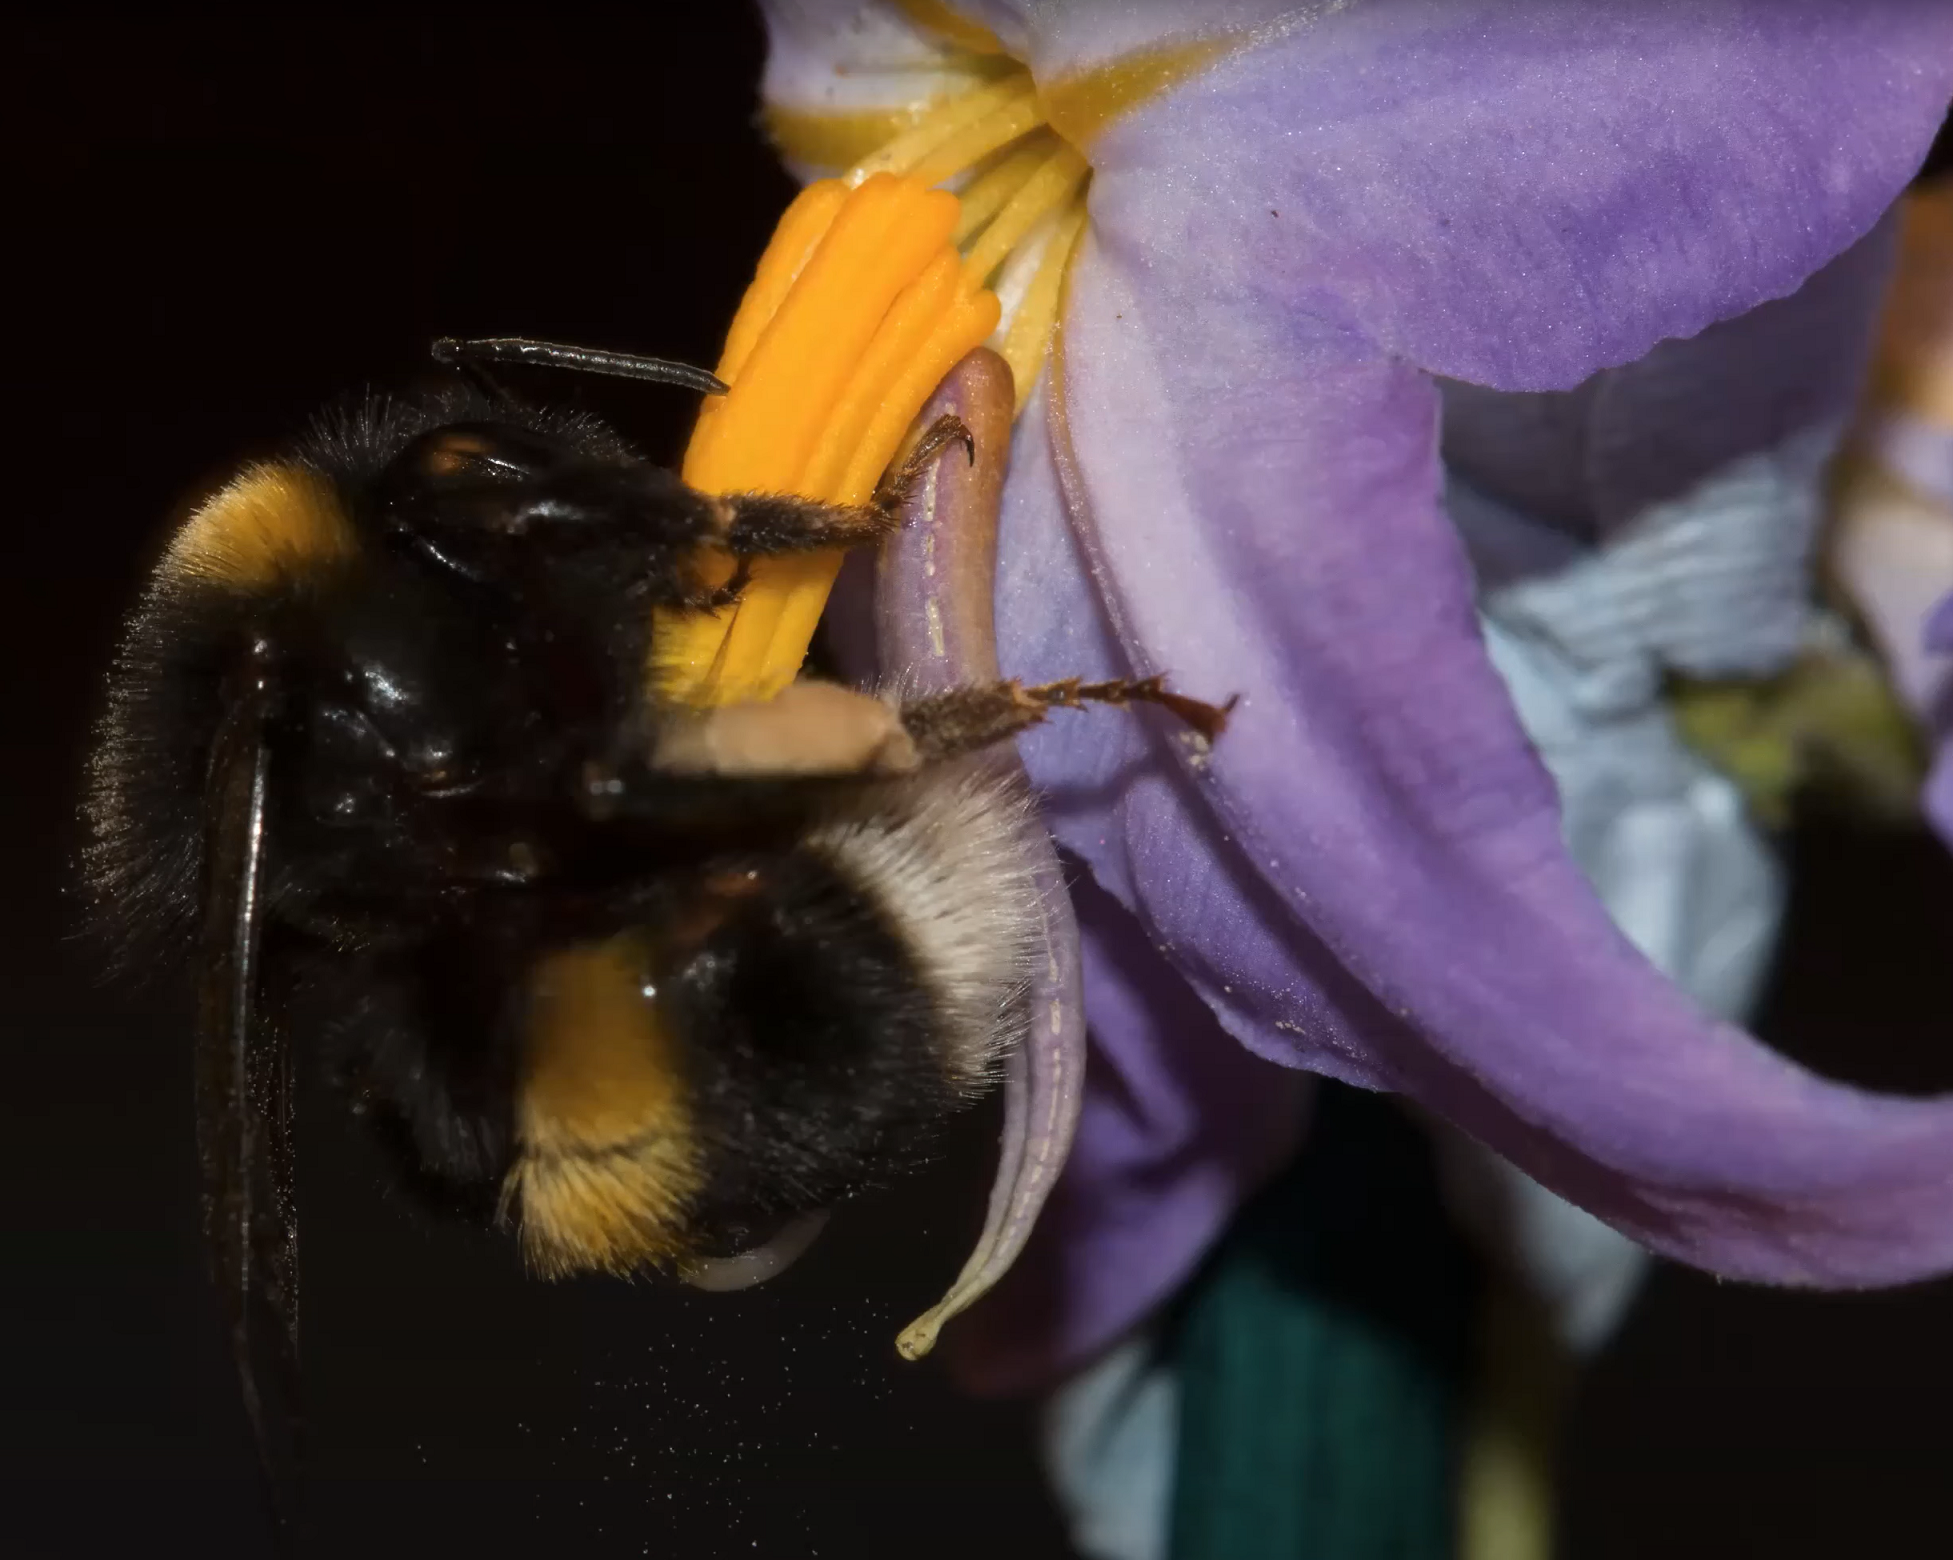
Visualizing Buzz Pollination
This project aims to showcase the current theory for the dynamics of pollen grains inside the anthers of certain flowers, when bumblebees interact with them. This phenomenon is called ‘Buzz Pollination’.
-
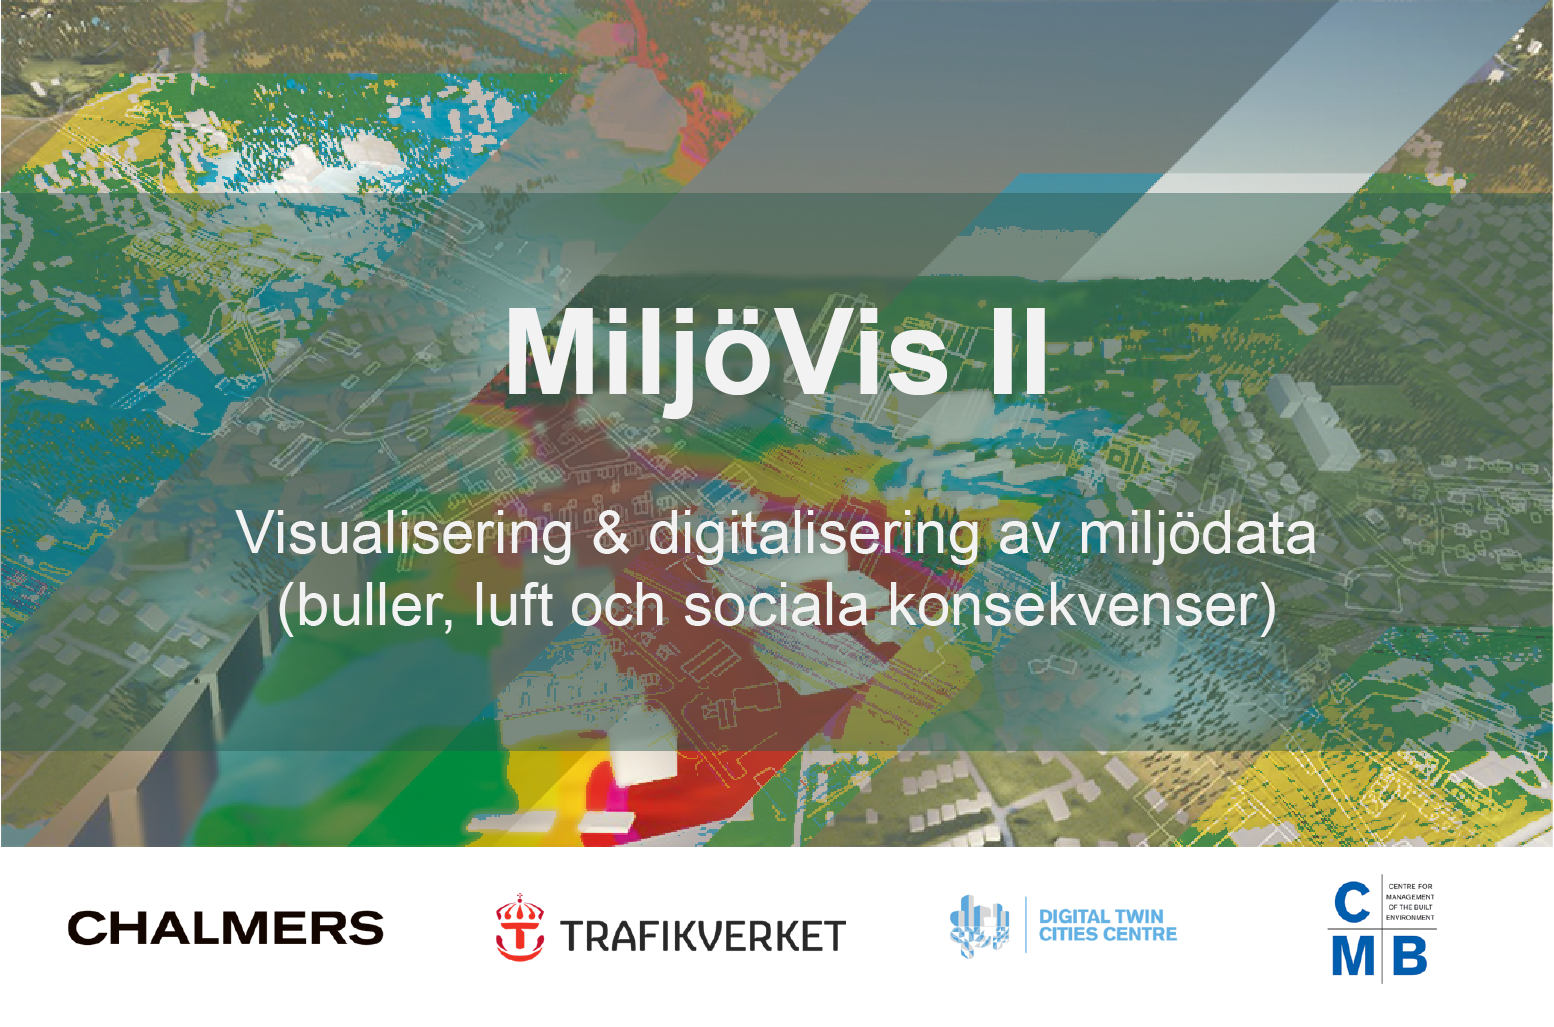
MiljöVis II & MålVis 2022 – 2024
The project aims to develop and scale up new methods and solutions for 3D-visualization of invisible data (air, sound, and social consequences)
-
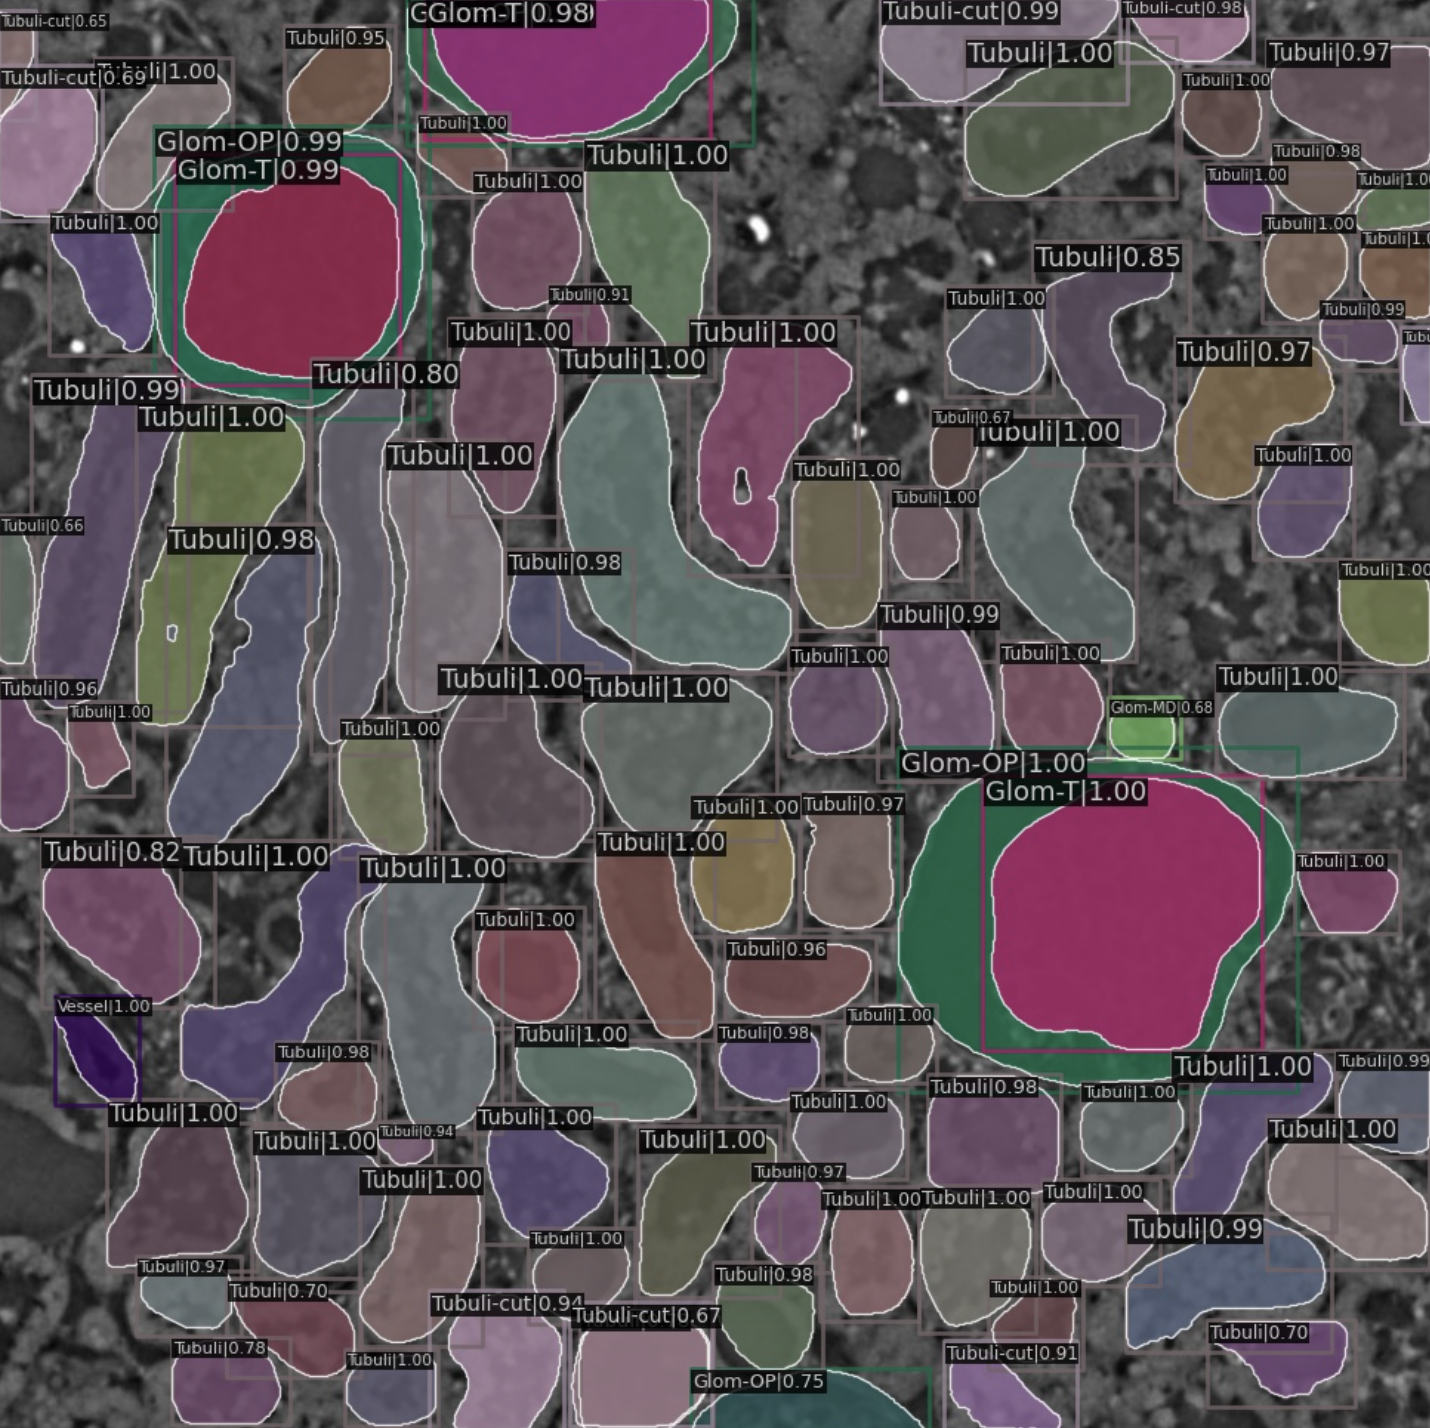
Segmenting Glomeruli and other structures from synchrotron X-ray microtomography datasets
Diabetes is a long-lasting health condition with serious complications. We studied a new group of rats with a specific genetic mutation linked to diabetes. Regardless of their gender and blood sugar levels, these rats were overweight and had larger livers, hearts, and kidneys compared to normal rats. A study of the size of Bowmans space…
-
Butterflies in Virtual Reality: developing workflows for efficient morphological segmentation and analysis of X-ray microtomography Datasets
Initially an InfraVis pilot project, the VR lab at LTH has worked with Sridhar Halali, a researcher at the LU Dept. of Biology. As part of his work to understand how butterflies have evolved in response to environmental changes, Dr Halali has collected a dataset of microCT scans of butterflies. The specific trait of interest…
-
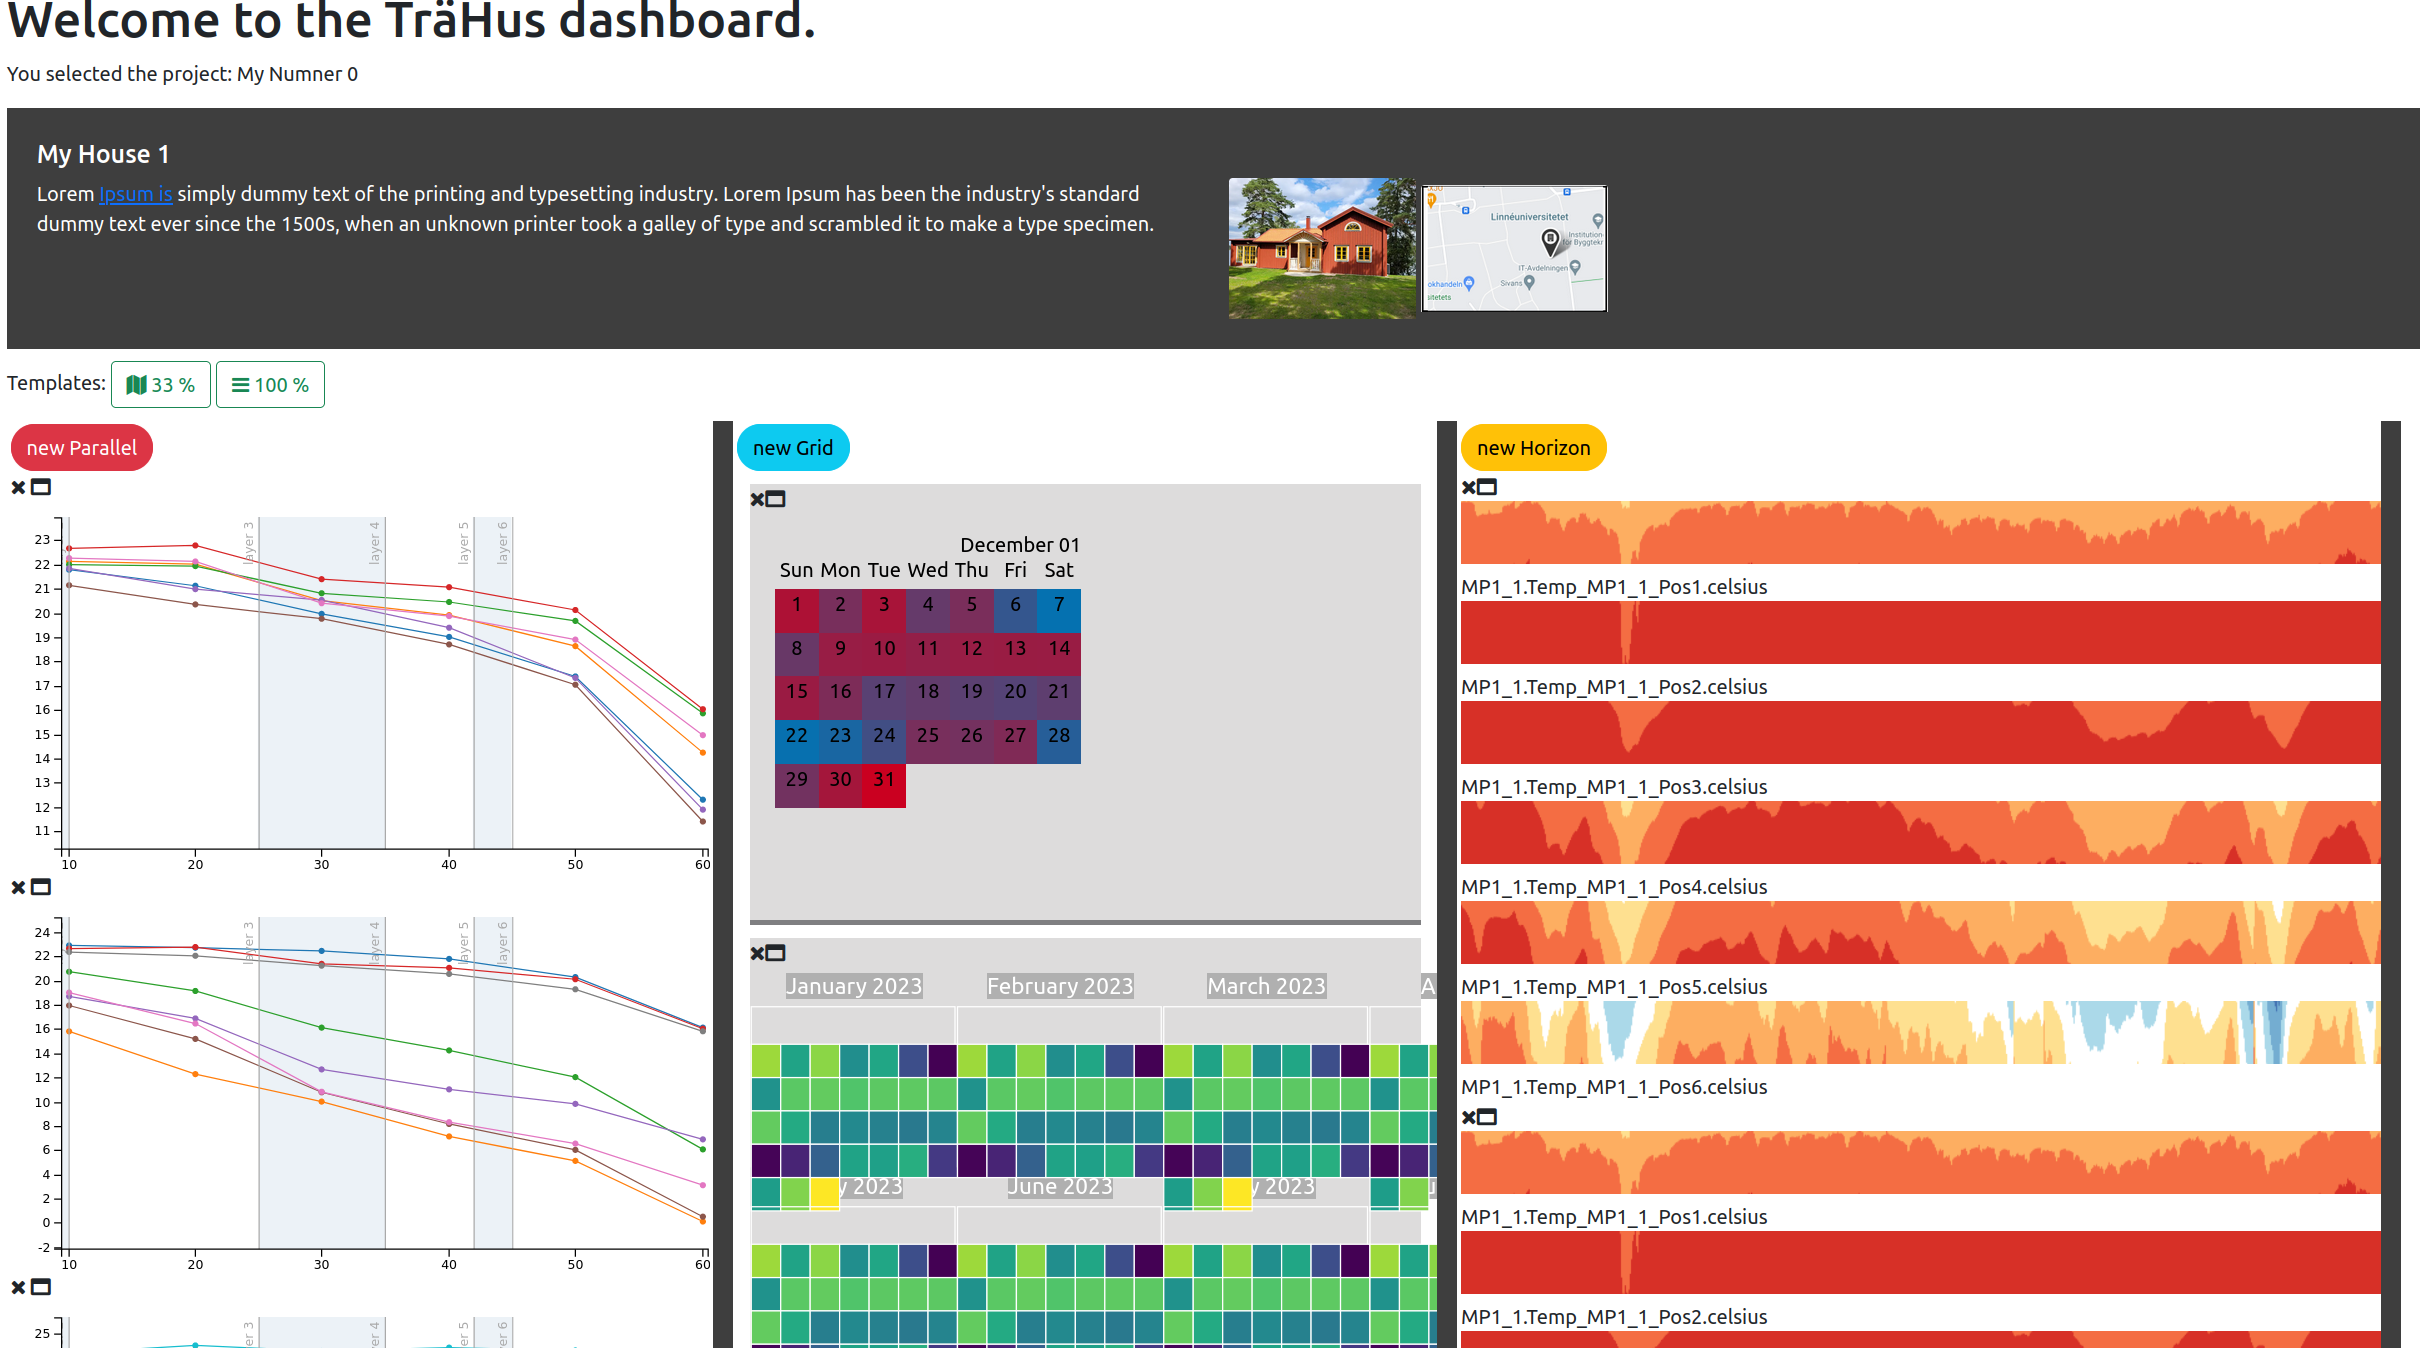
The pulse of the wood
Monitoring of Wooden houses: Time series of sensors data measuring humidity, temperatures, vibrations and weather conditions.
-
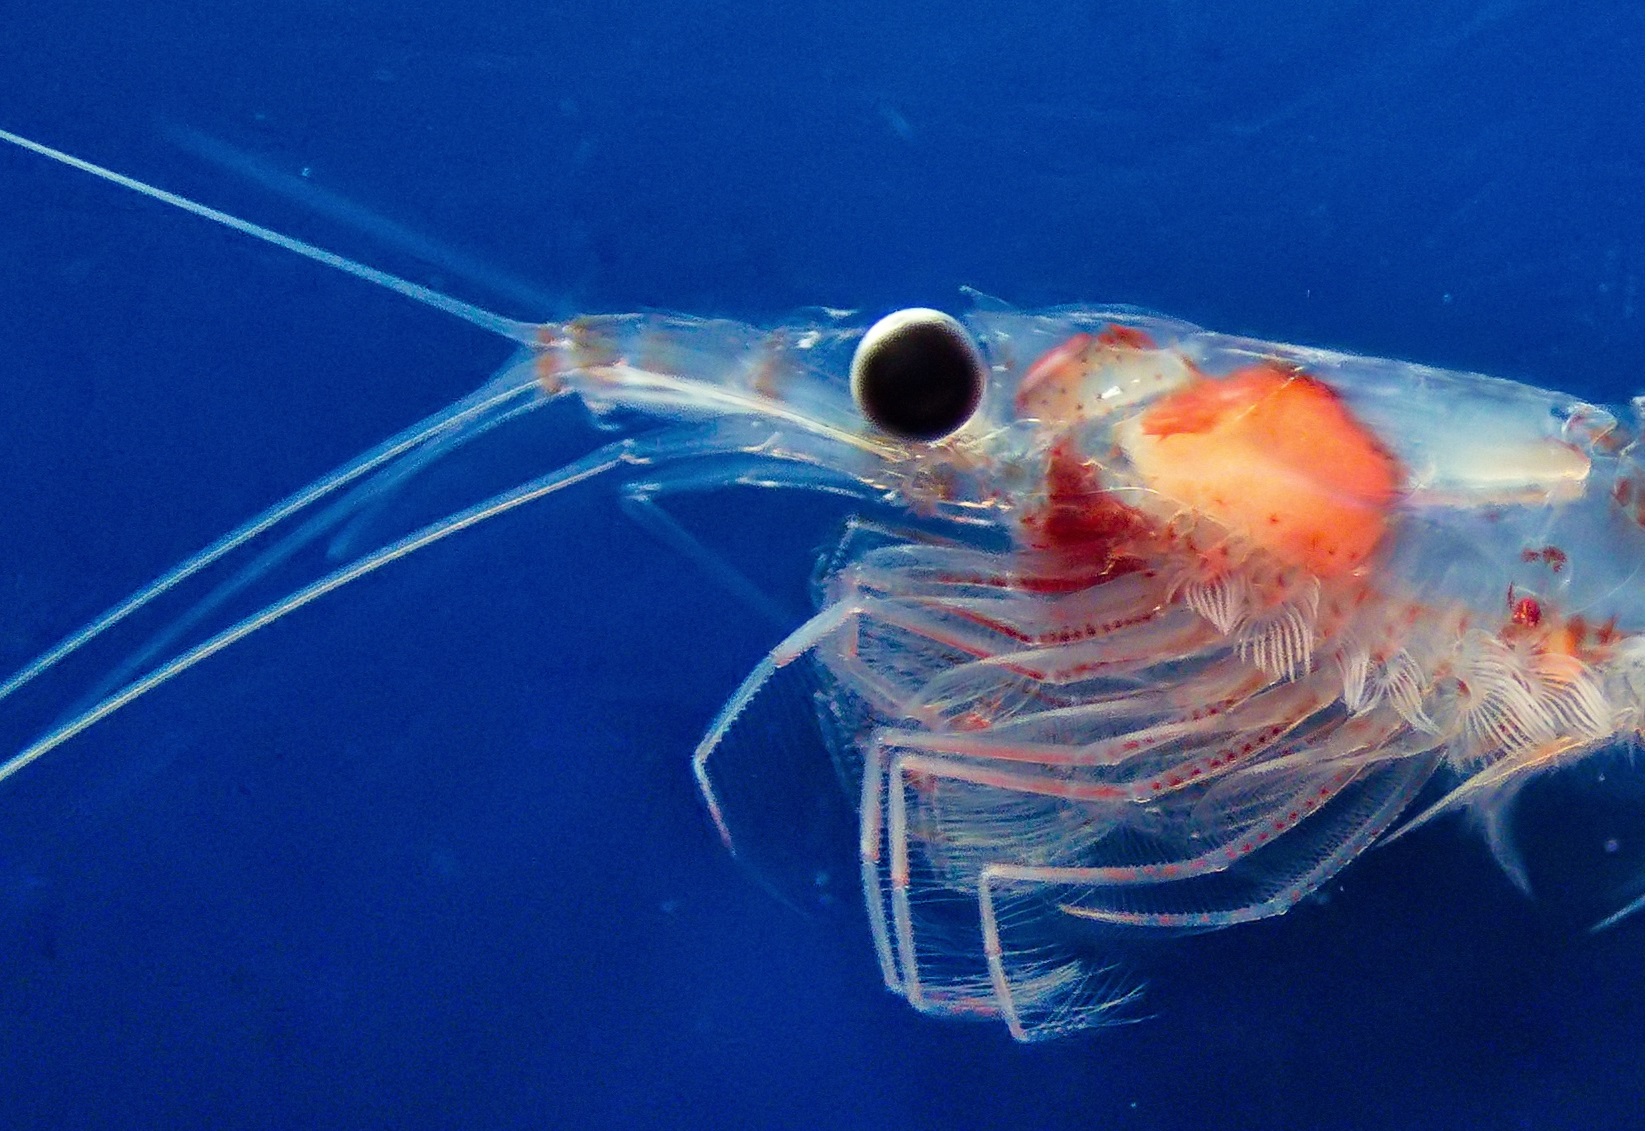
SEAD Conservation Paleobiology
This project aim to demonstrate the availability of a long-term record of biodiversity data which could be used to understand the biodiversity implications of the current climate and extinction crisis. The visualisation can lead to a discussion about the regulations for sound environments, and to the initiation of new research questions about health effects.
-
Virtual Reality applications in the cloud
The project aims at designing an infrastructure that supports VR applications in the cloud using 5G/6G. The visualisation can lead to a discussion about the regulations for sound environments, and to the initiation of new research questions about health effects.
-
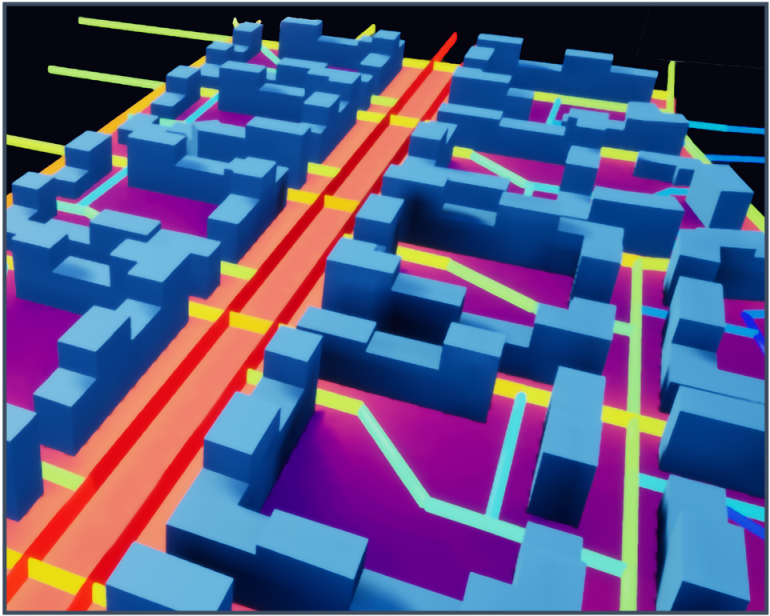
Visualization of pedestrian noise exposure
We develop an interactive map where the impact of noise is dynamically visualised through heatmaps over the course of a day as a synthesis of pedestrian traffic and noise level at a certain place and time. The visualisation can lead to a discussion about the regulations for sound environments, and to the initiation of new…
-
3D mapping of cortical changes leading to epileptic seizures
Epilepsies are a family of devastating disorders characterized by spontaneous, recurrent seizures. It is one of the most common brain disorders and considered the most burdensome neurologic disorder worldwide. Available pharmacological treatments are only symptomatic, often with side effects and fail to adequately control seizures in one third of patients.
-
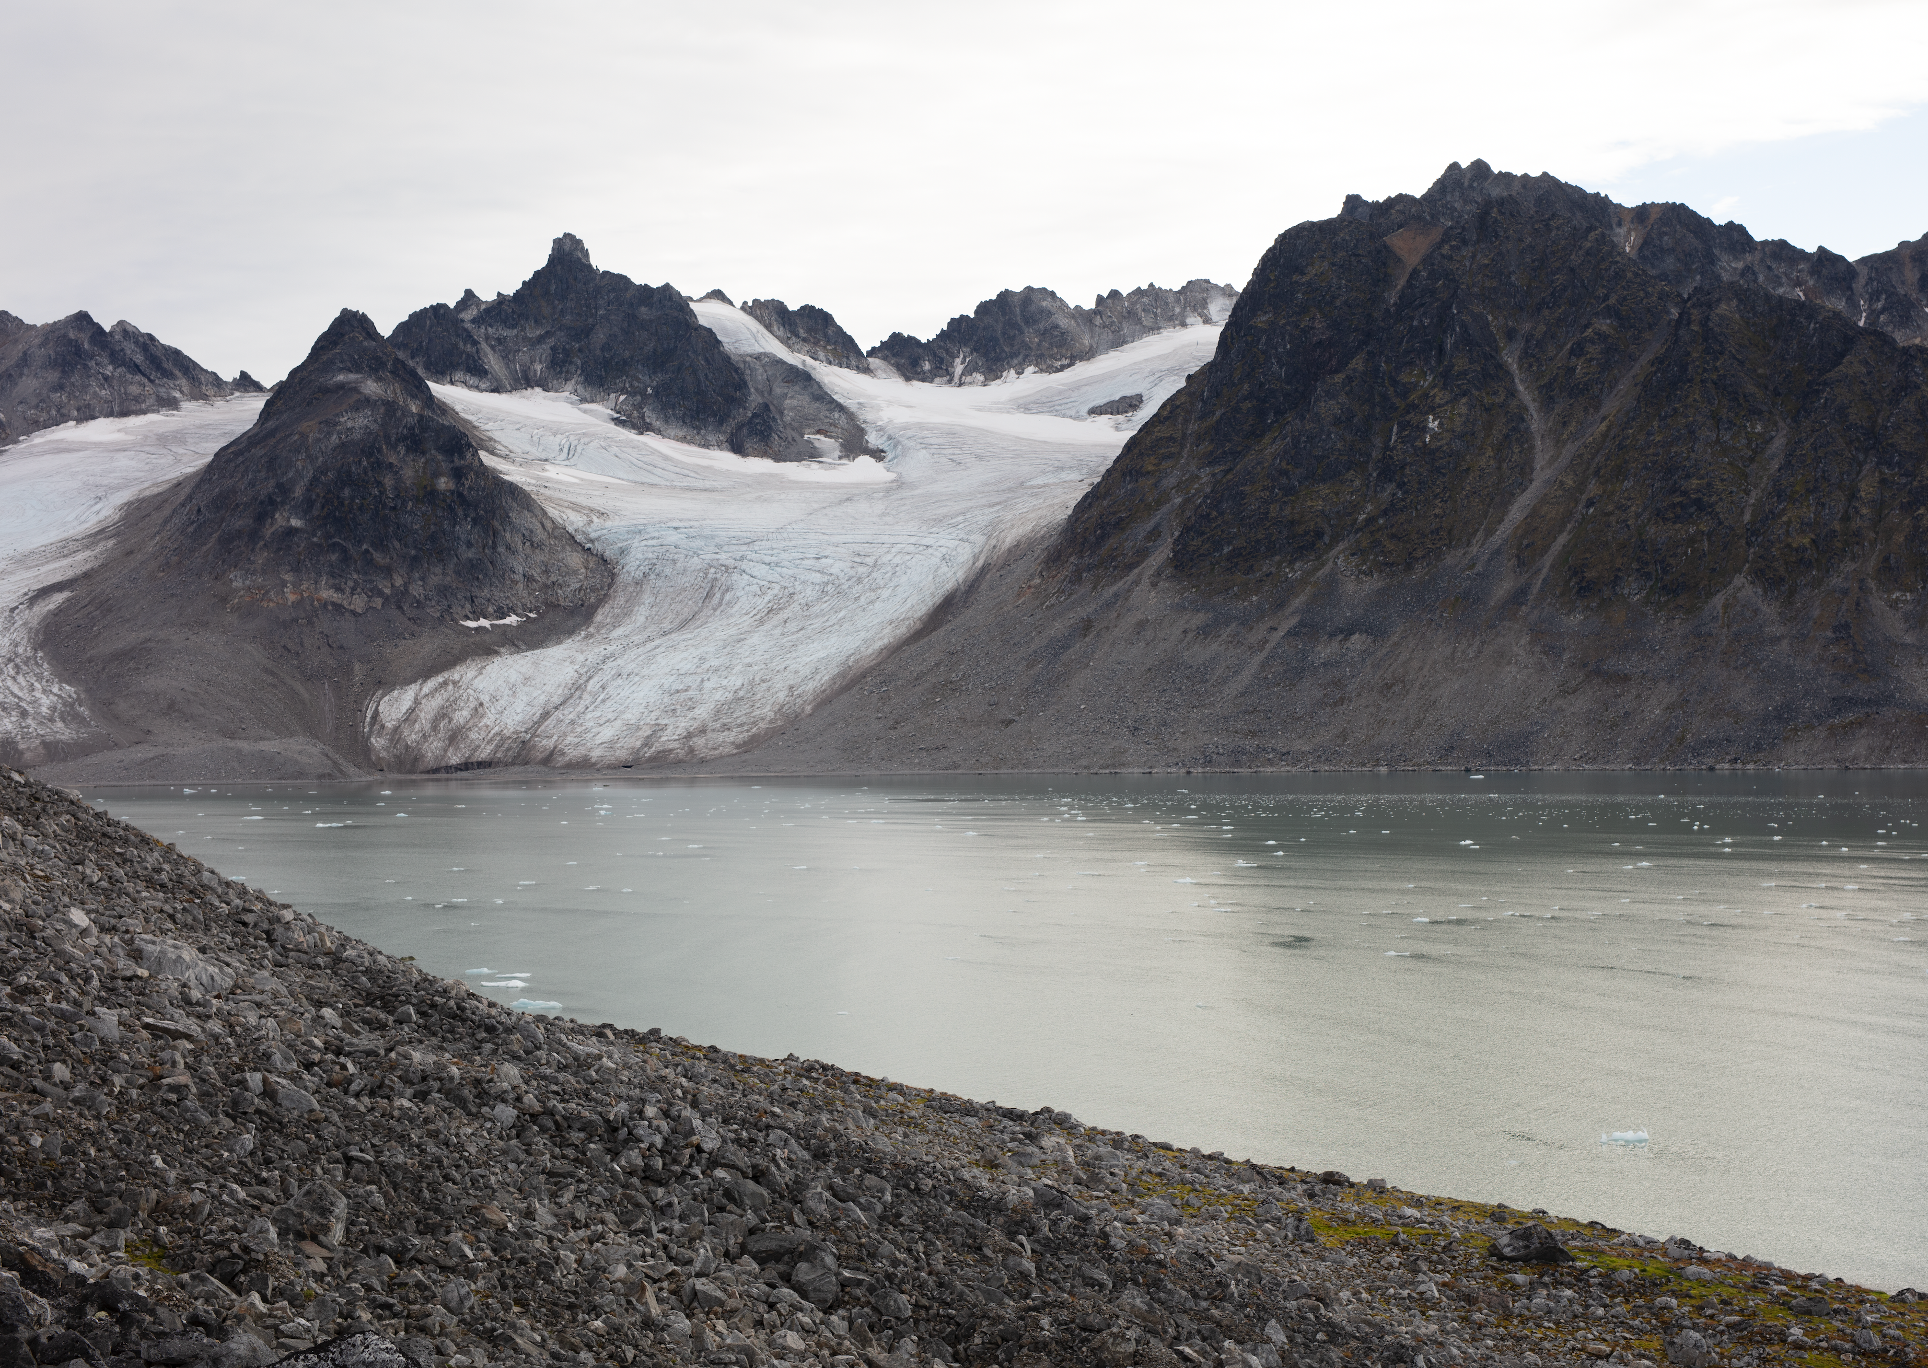
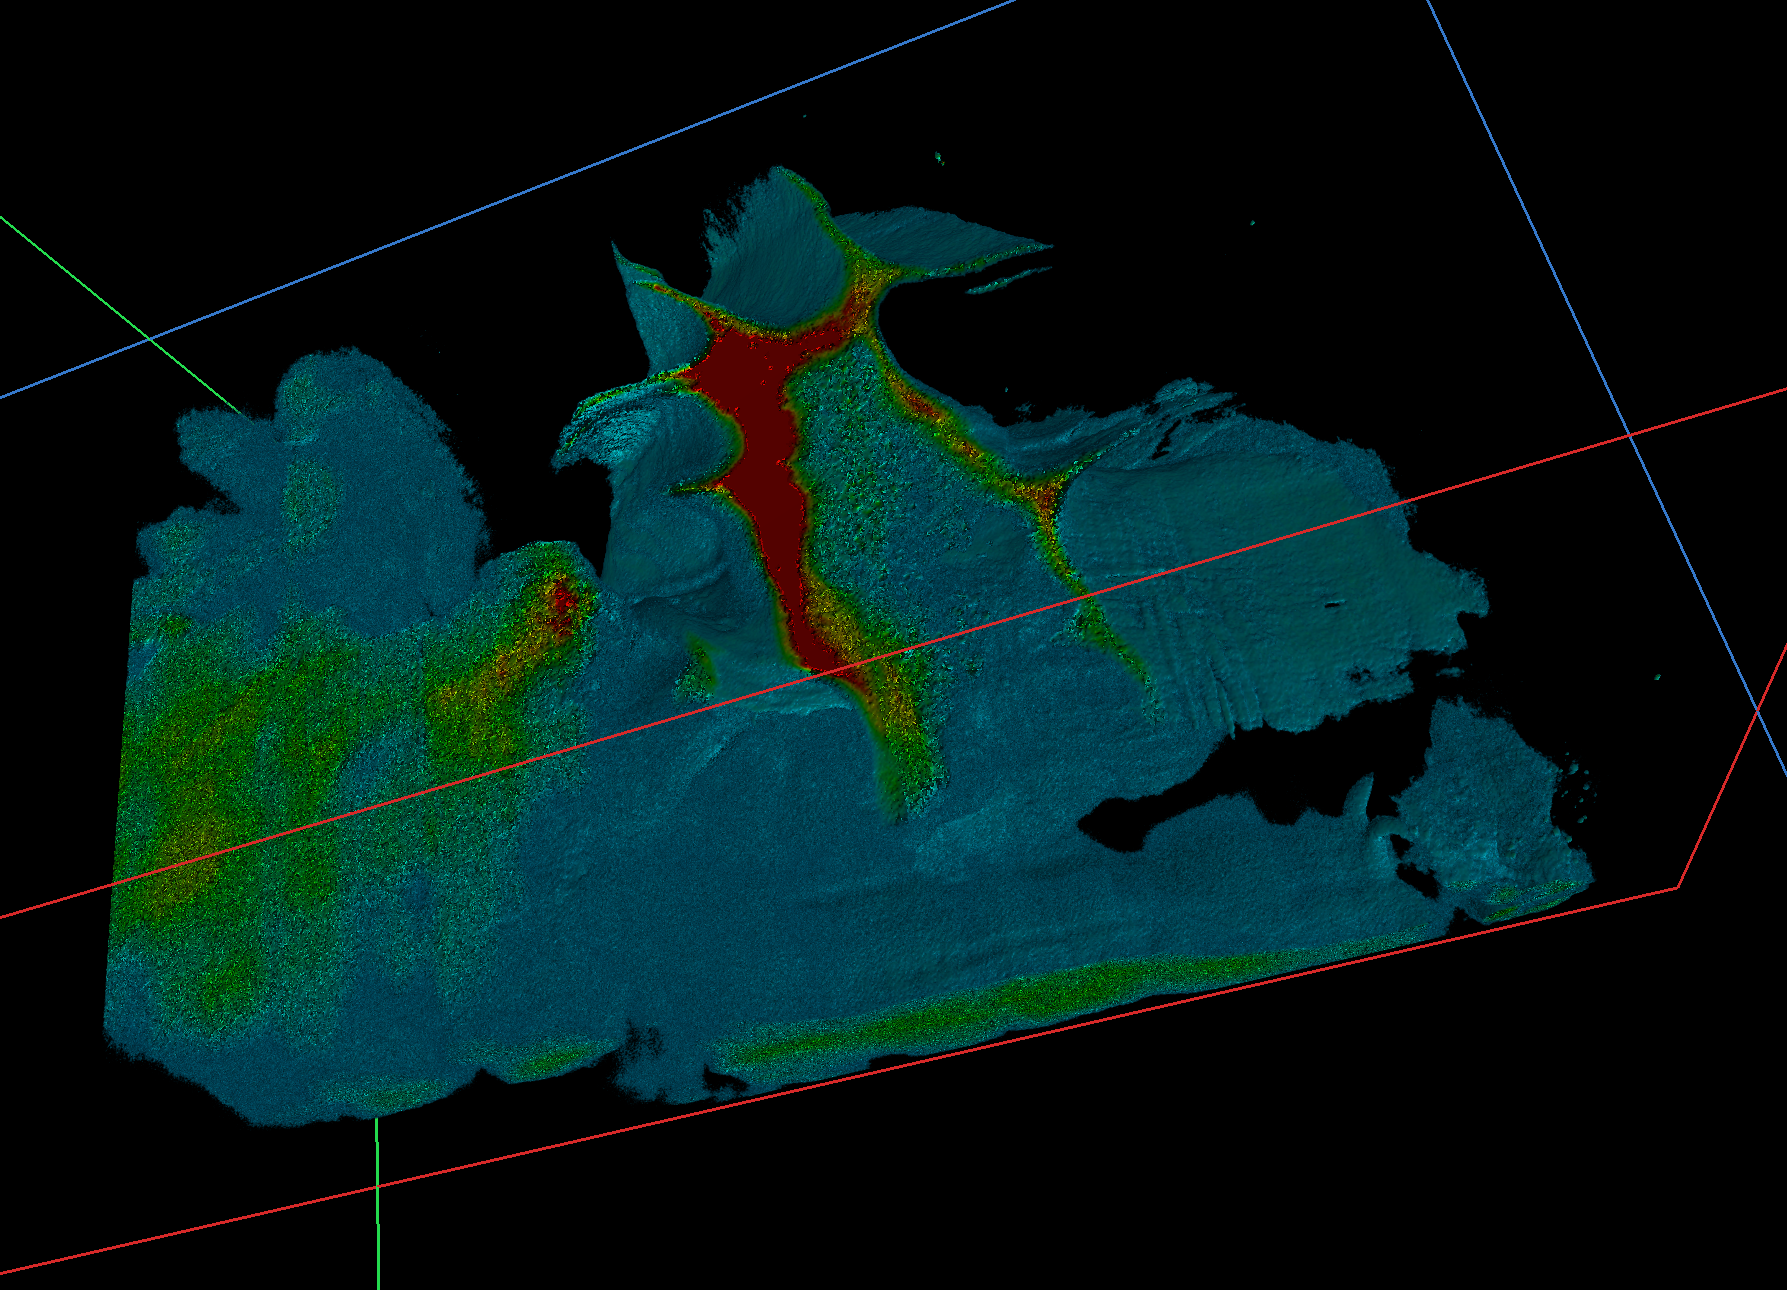
Extended Rephotography
We develop interactive spatio-temporal views of arctic areas affected by climate change, where the researchers can register their data and compare the material to trace the changes of the landscape over time.
-
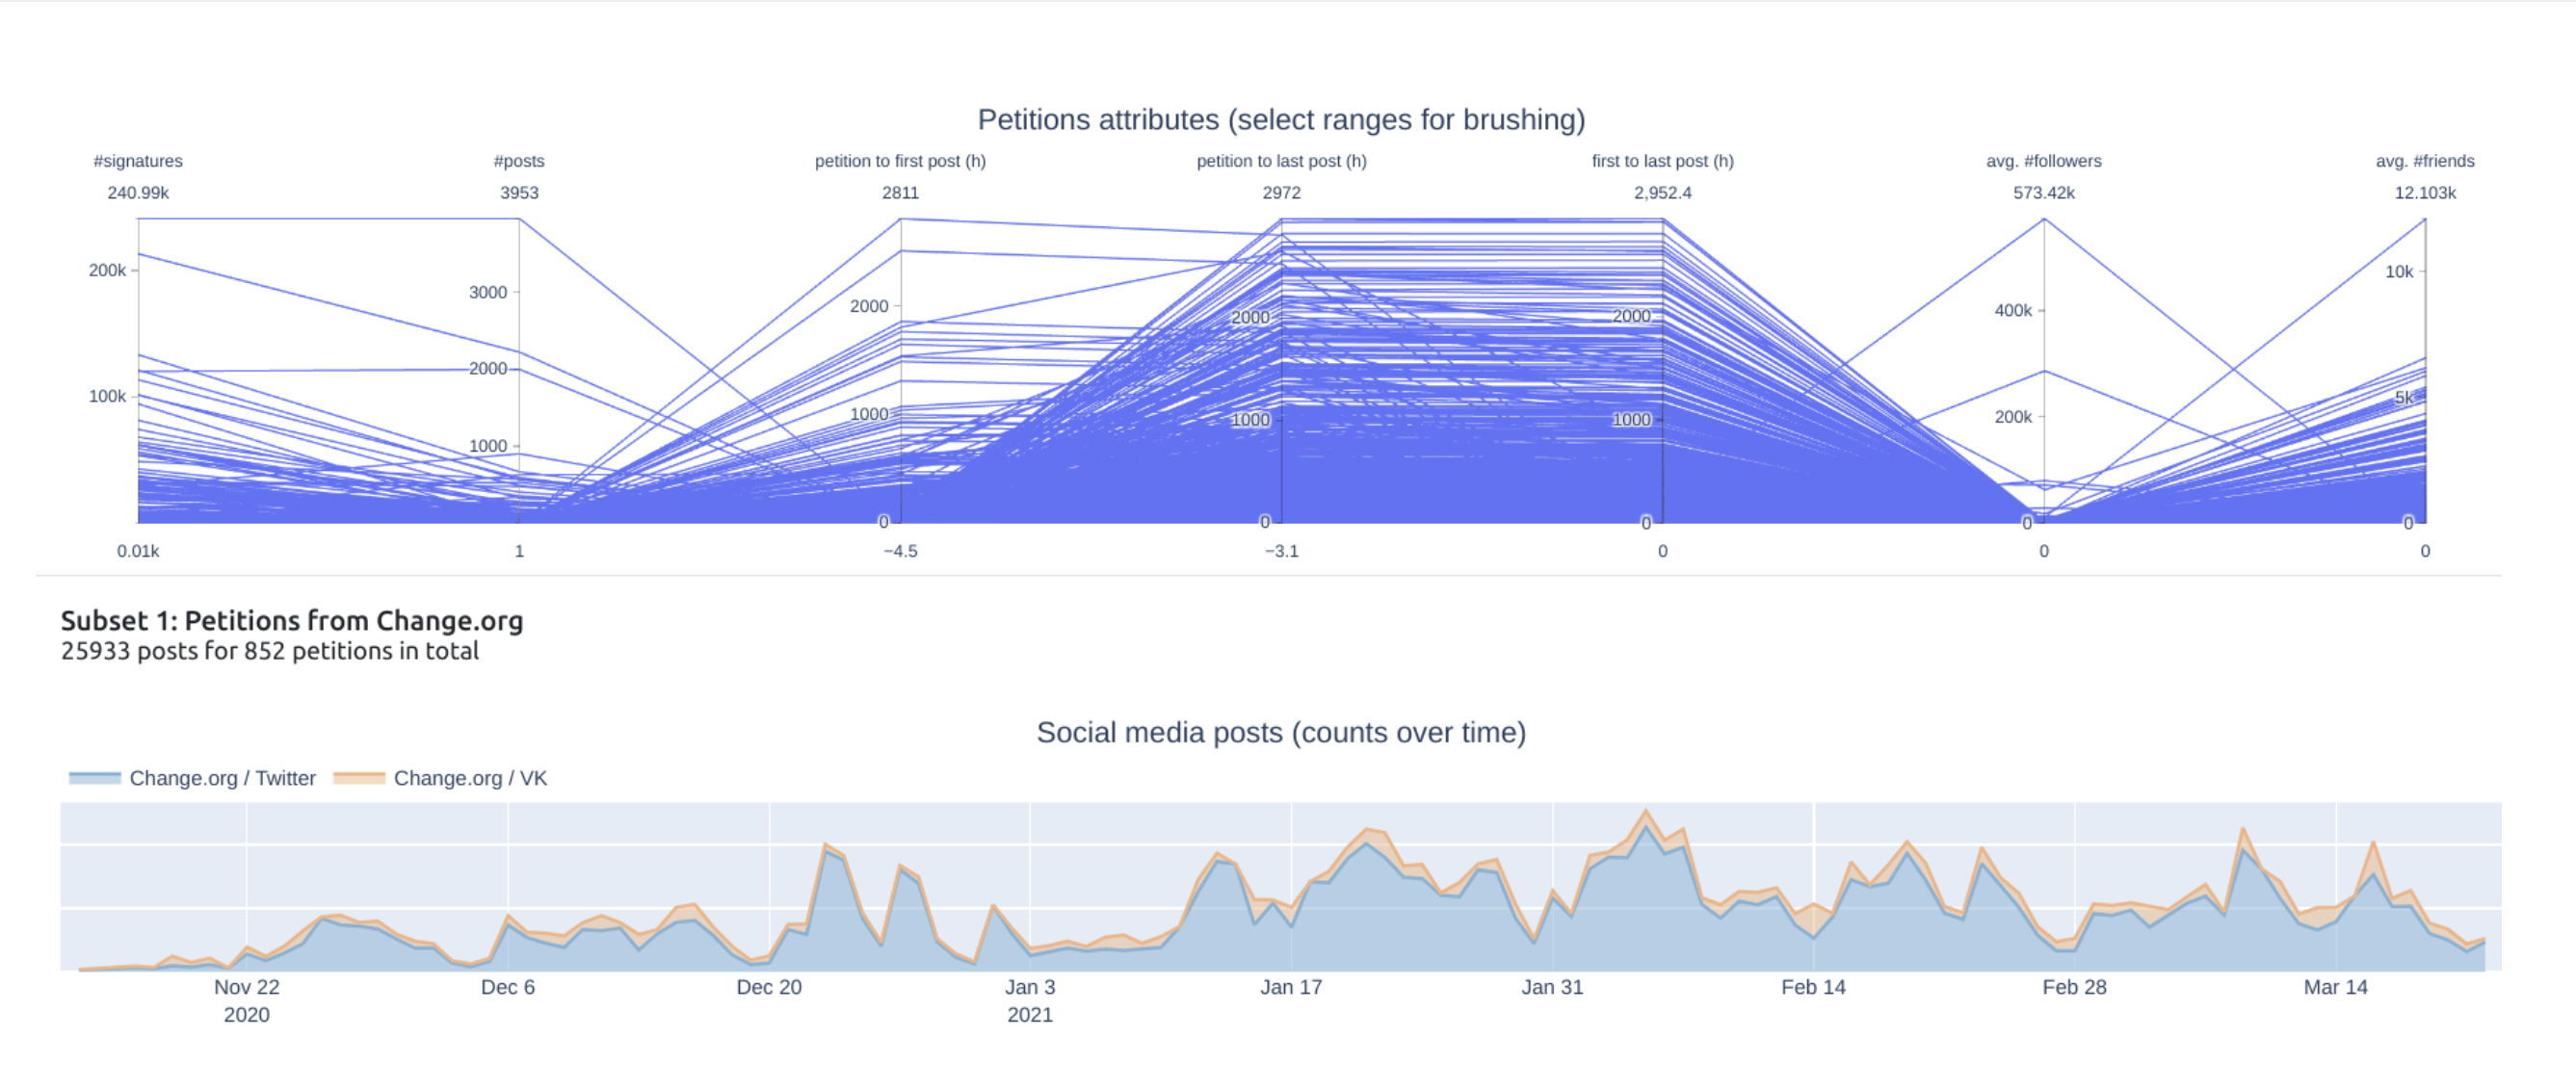
Analysis of Online Activism Factors Based on Online Petition and Social Media Data
Researchers in political science make use of an information visualization dashboard to understand how the contents of social media posts addressing published e-petitions relate to the theoretical model of mobilisation strategies.
-
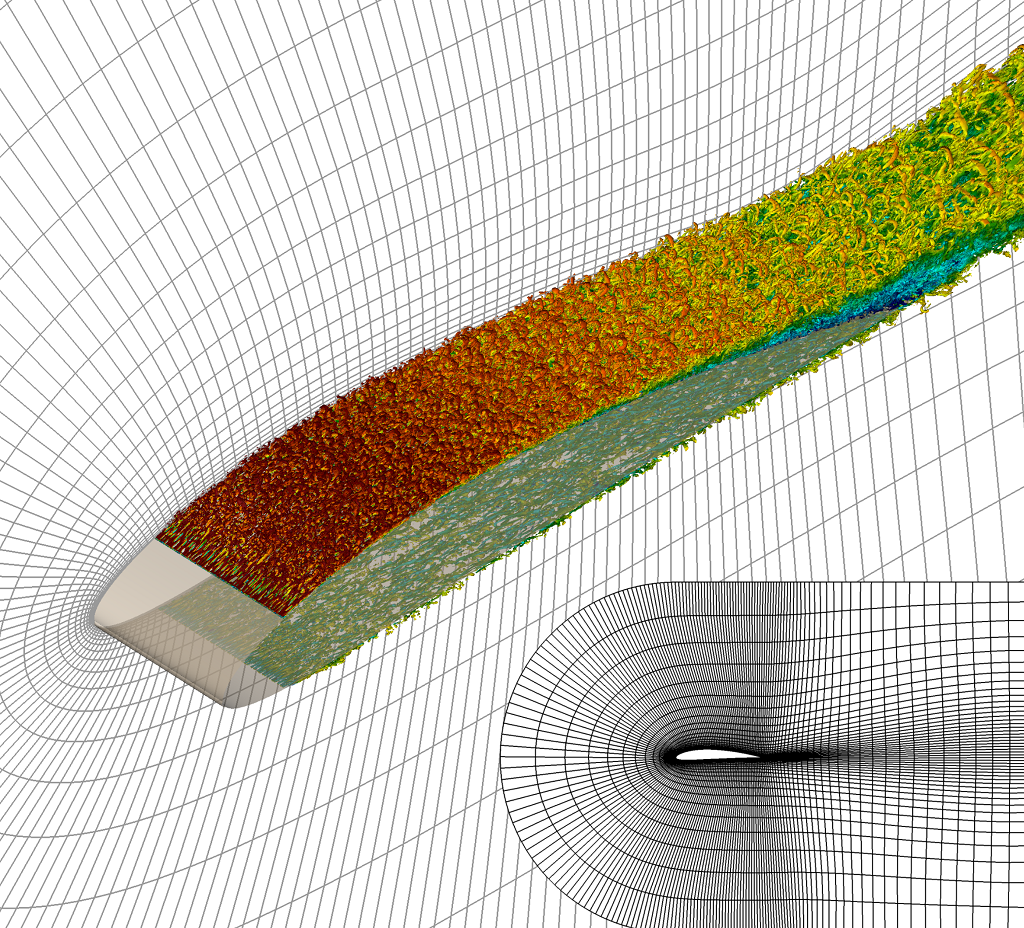
In-situ Visualization Support in Nek5000
The researchers visualize the behavior of wind around airplane wings while the simulation is running on a supercomputer. A deeper insight into wind behavior will aid engineers in designing more efficient aircraft.
-
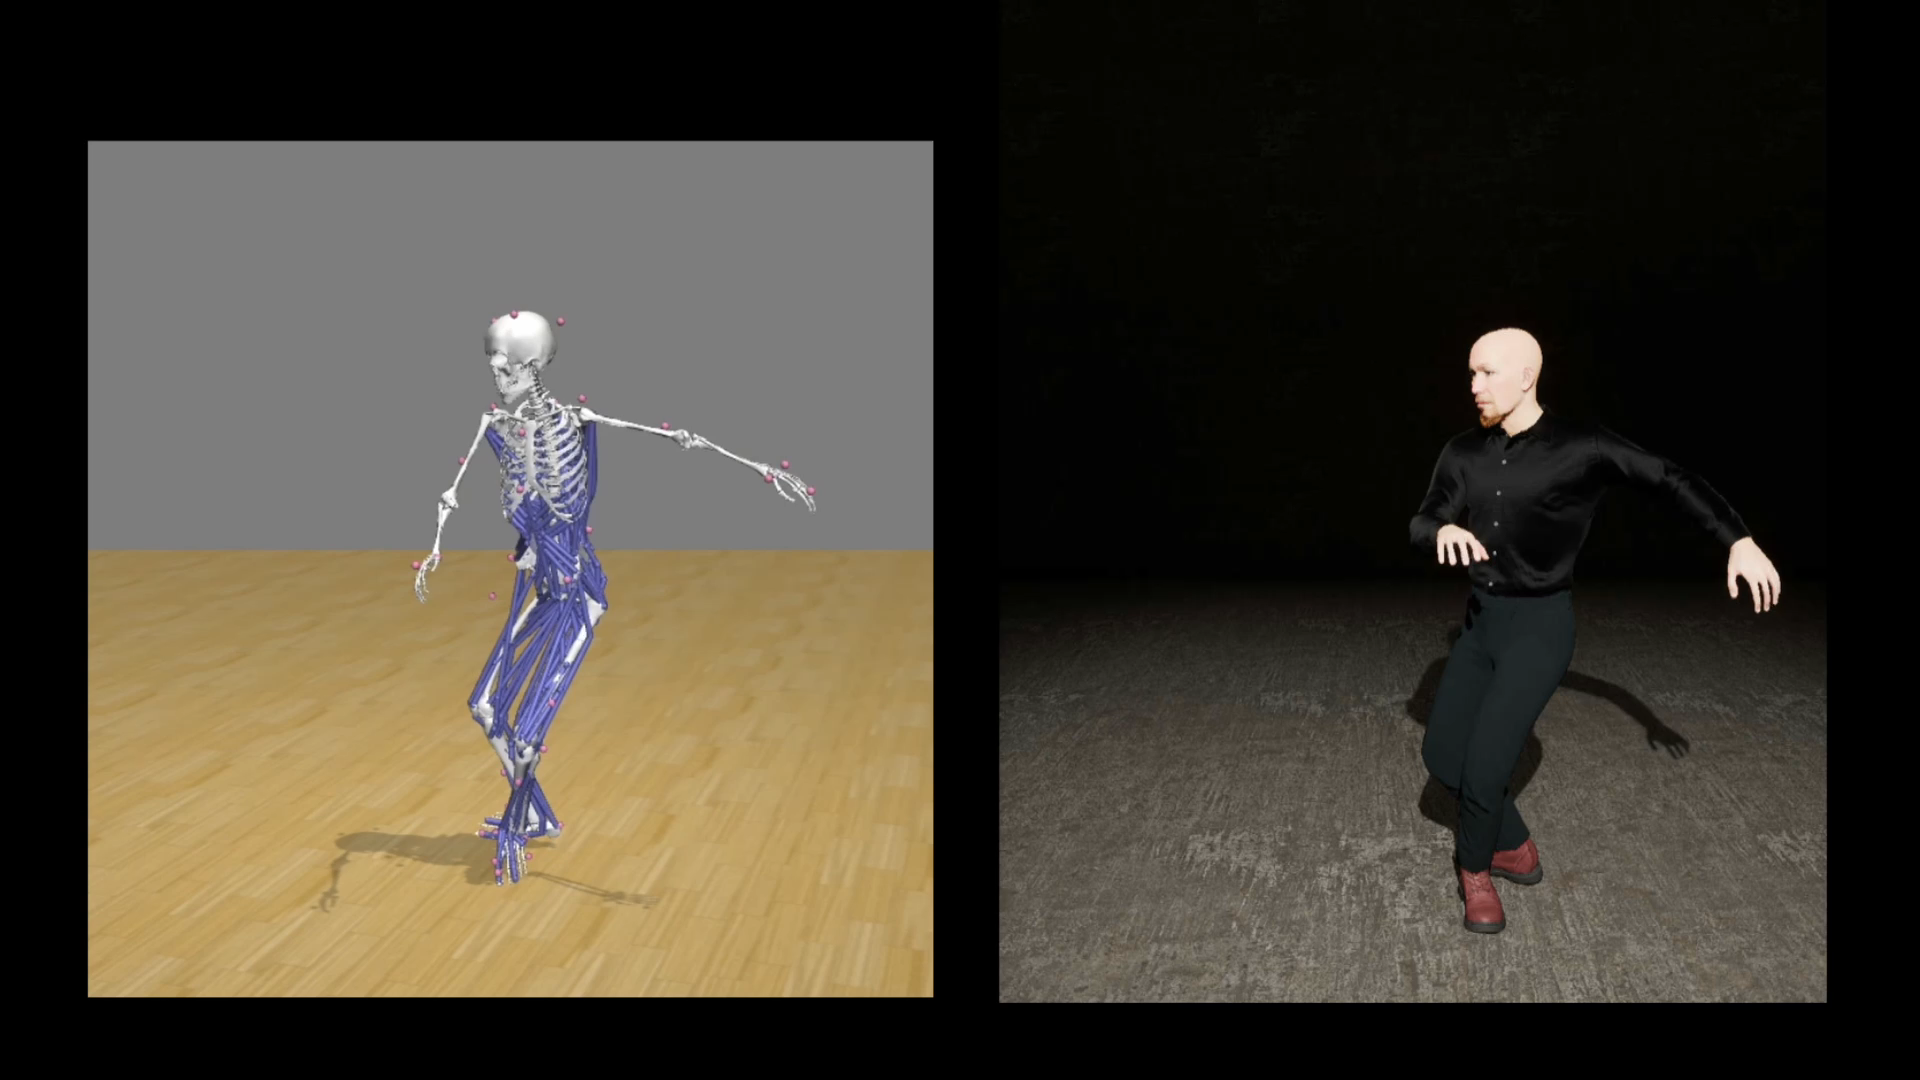
Medical Digital Twin
InfraVis helps bring the data to life with Motion Capture animations and realistic 3D models of patients to help communicate medical information in a more personalized way.