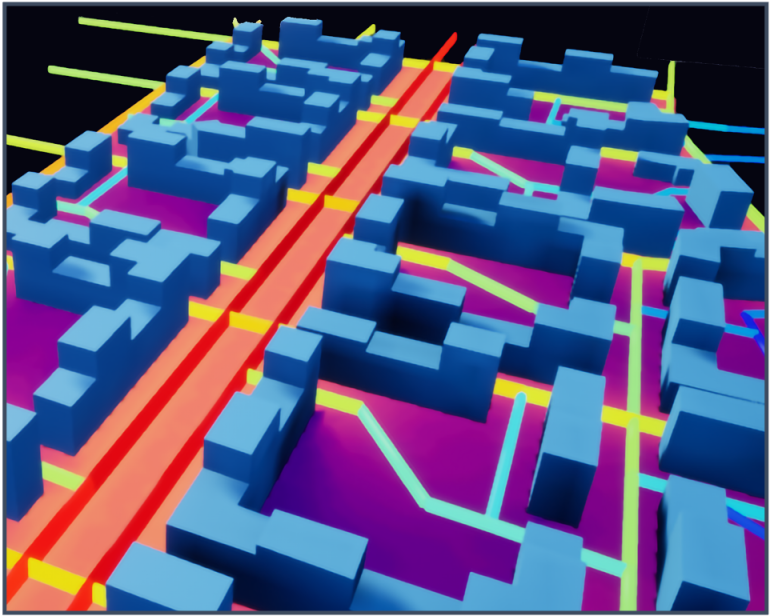
Visualization of pedestrian noise exposure
InfraVis User
Jens Forssén
InfraVis Application Expert
Oscar Ivarsson
InfraVis Node Coordinator
Jonathan Westin
Tools & Skills
Keywords
About
We develop an interactive map where the impact of noise is dynamically visualized through heatmaps over the course of a day as a synthesis of pedestrian traffic and noise level at a certain place and time.
The visualization can lead to a discussion about the regulations for sound environments, and to the initiation of new research questions about health effects.