MiljöVis II & MålVis 2022 – 2024
InfraVis User
Beata Stahre Wästberg
InfraVis Application Experts
Fabio Latino, DTCC (Vasilis Naserentin, Orfeas Eleftheriou)
InfraVis Node Coordinator
Jonathan Westin
InfraVis Project Manager
Fabio Latino
About
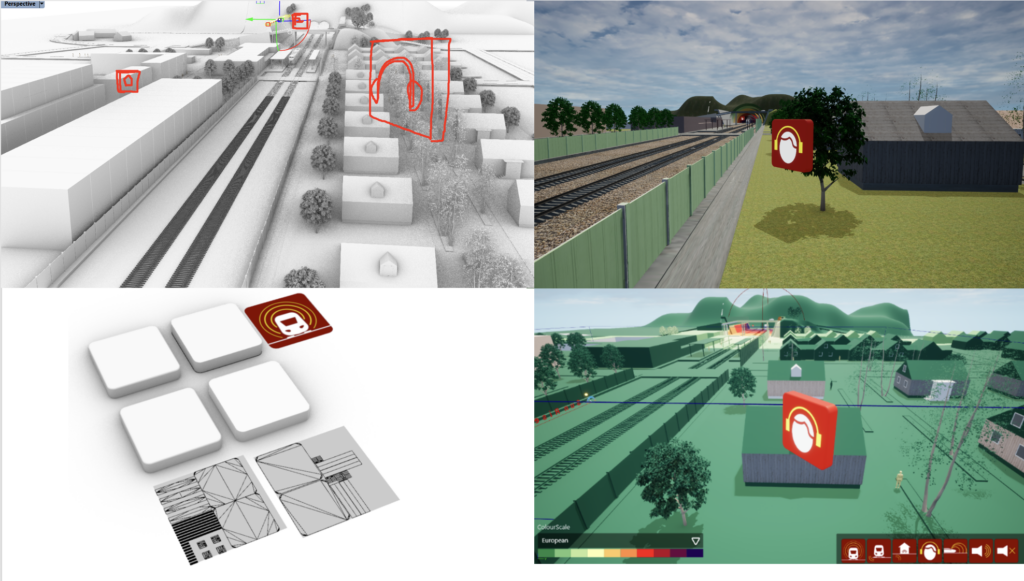
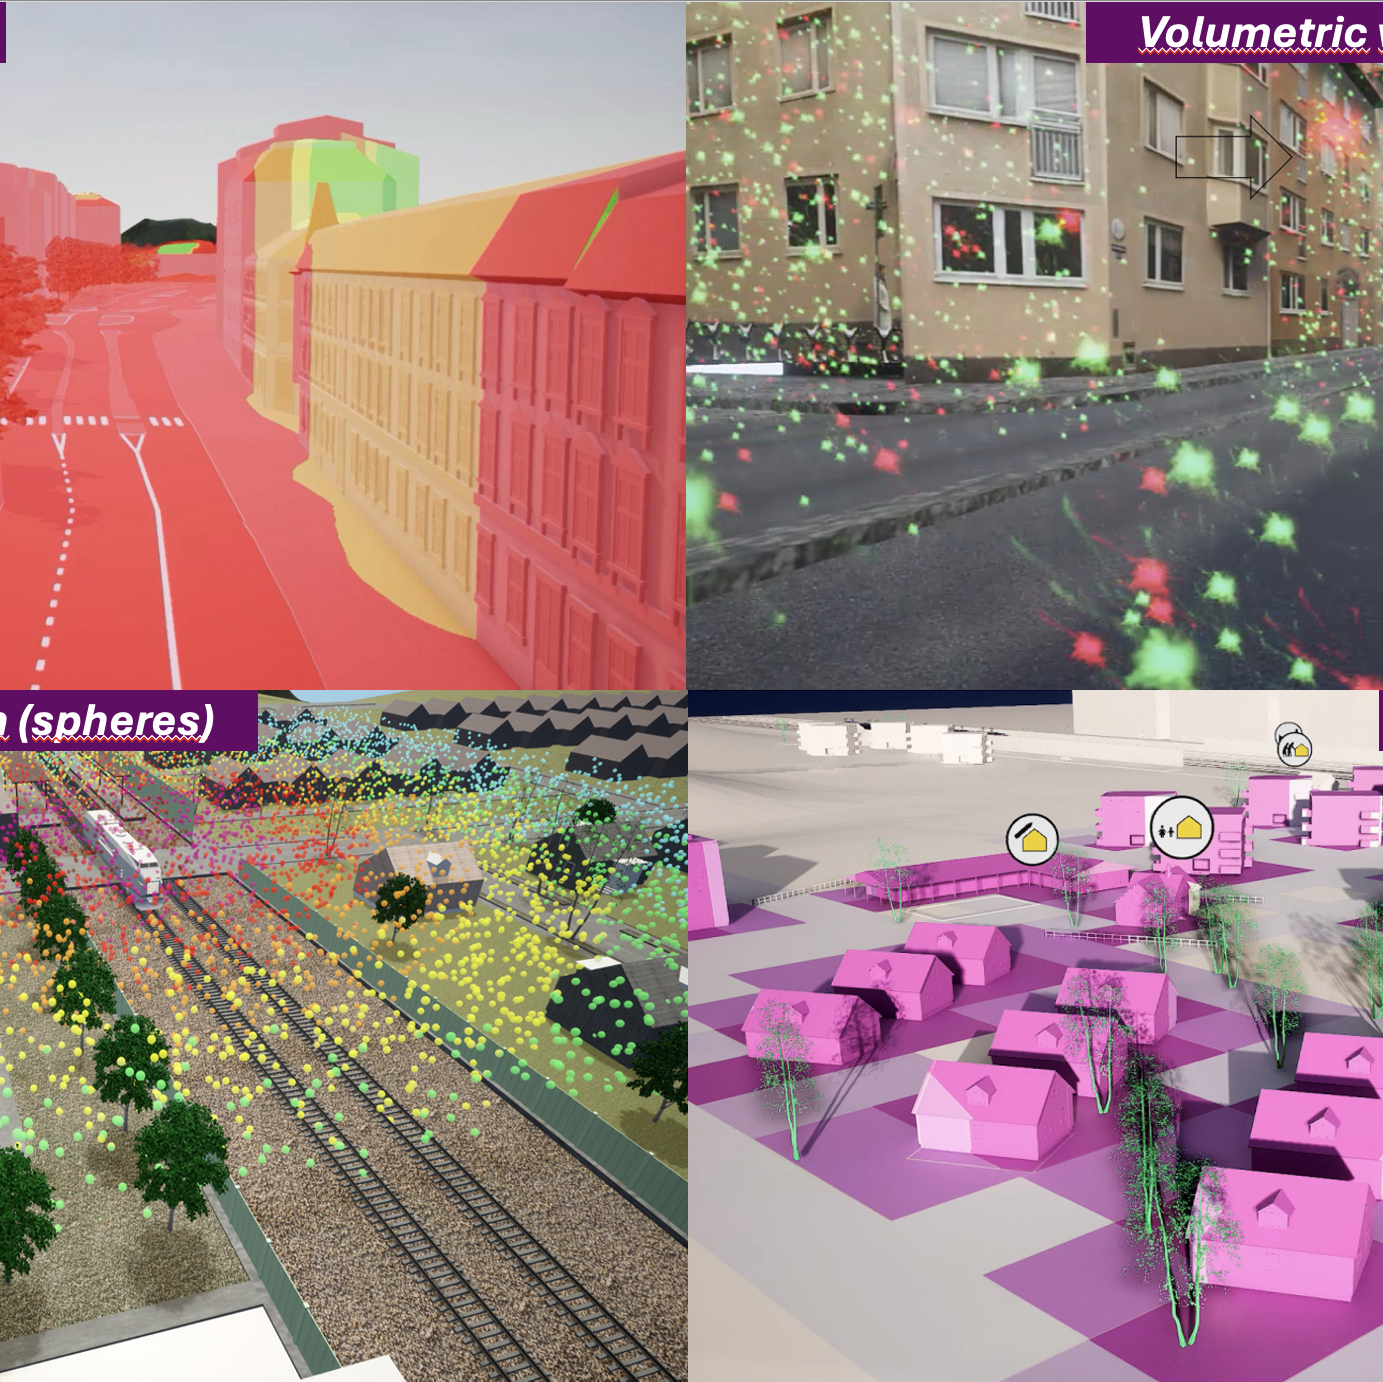
The transdisciplinary project MiljöVis II aims to further develop and scale up new methods and solutions for 3D-visualization of invisible data (air, sound, and social consequences) in large scale infrastructure models, developed in an earlier project (MiljöVis I). The focus in the project lies on how to visualize different data sets simultaneously in order to see their joint environmental and social impact. The goal of the project is to develop a visual syntax for visualization of complex data in 3D-models and thus create clearer means of communication, a more efficient base for decision-making, and contribute to a more effective quality assurance during the planning and construction process. An additional goal is to see synergies and conflicts more easily between different target images.
The project is a collaboration between Chalmers University of Technology (Depts of Computer Science & Engineering and Architecture and Civil Engineering), the Swedish Transport Administration (Trafikverket) and the Digital Twin Cities Centre.
Outcomes:
- To develop and scale up new methods and solutions for 3D visualization of invisible data (air, sound, and social consequences);
- Visualizing different data set simultaneously, to see their environmental and social impact;
- Develop a visual syntax for visualisation of complex data in 3D-models for a more efficient decision-making;
Team:
- Principal Investigator (PI): Beata Stahre Wästberg
- InfraVis Project Manager and Application Expert: Fabio Latino
- InfraVis Application Experts: DTCC
- InfraVis Node Coordinator: Jonathan Westin