VIAMD (Visual Interactive Analysis of Molecular Dynamics)
VIAMD (Visual Interactive Analysis of Molecular Dynamics) is an innovative open-source software designed to enhance and streamline the analysis of molecular dynamics (MD) simulations.
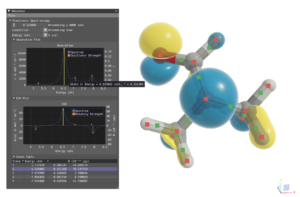
VIAMD (Visual Interactive Analysis of Molecular Dynamics) is an innovative open-source software designed to enhance and streamline the analysis of molecular dynamics (MD) simulations.
The InfraVis newsletter comes out four times per year. This is the June 2026 edition.

We are delighted to share that DataCatalyst Öresund has been approved through Interreg Öresund-Kattegat-Skagerrak. The project brings together Lund University, DTU – Technical University of Denmark and Medicon Valley Alliance Microbiome Network to strengthen data-driven research and innovation across the Öresund region over the next three years.
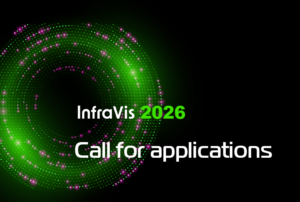
InfraVis Call For Visualization Support is open throughout October 2026.
Welcome with your application!
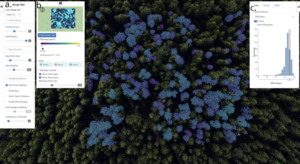
ForestVis is a web-based 3D visualization system for the interactive visual exploration of forest data.

In this project, simple, multilingual videos were created to help refugees better understand and give informed consent to research participation.
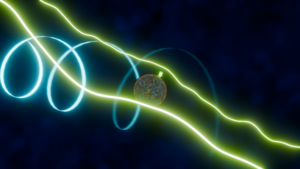
The research group led by Ilaria Testa (KTH, SciLife Lab) has developed a novel method for measuring the rotation of molecules in a solution.
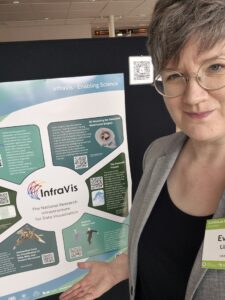
Evelina Liliequist and Maria Podkorytova presented InfraVis at the SciLifeLab Infrastructure Day at Umeå University on 11 May.
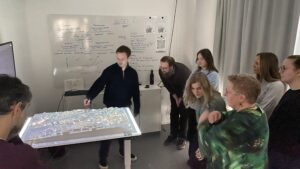
Urban planning is complex, and rising water levels due to climate change add further challenges.
How do digital humanities researchers work with large and complex datasets?
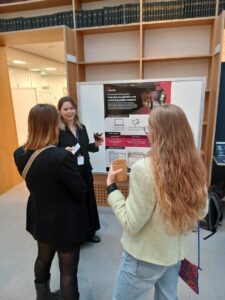
At the DHNB: Digital Humanities in the Nordic and Baltic Countries 2026 conference in March, InfraVis was presented by Linnéa Tjernström and Evelina Liliequist (both from the Umeå University node at Humlab) at Aarhus University through a poster and lightning talk.