Advanced Visualization for Nutrient Recovery

Searching for phosphates in tiny particles of dust and soot, using
advanced visualizations and data analysis of volume slices from XRF uCT
scans.

Describing mid-level support projects.
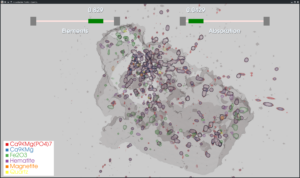
Searching for phosphates in tiny particles of dust and soot, using
advanced visualizations and data analysis of volume slices from XRF uCT
scans.
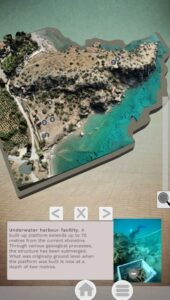
PAST – Platsen Asine Spår och Tid, brings archaeological heritage to life through interactive digital storytelling. By combining digital technologies with rich archaeological data, the project creates an immersive experience where visitors can explore archaeological heritage and research through an interactive touchscreen installation at Gustavianum Museum in Uppsala.
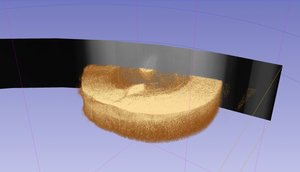
InfraVis helped develop a real-time visualization tool for complex CT scan data (sinograms), allowing researchers to spot measurement issues early, identify areas of interest, and reduce the need for time-consuming reconstructions during imaging experiments.
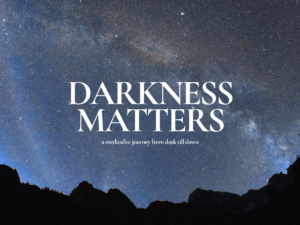
Darkness Matters is a fulldome documentary and research project offering a meditative journey through natural darkness bringing awareness about the increasing issue of light pollution. Costanza Julia Bani contacted InfraVis with the goal of bringing a future perspective on the light pollution issue.
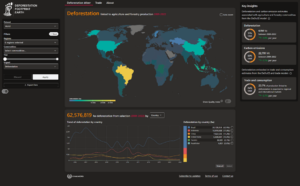
This interactive web platform, developed with support from InfraVis, helps users explore how global commodity trade drives deforestation and carbon emissions through intuitive visualisations.
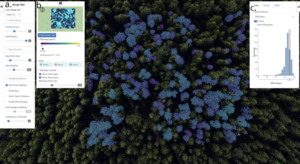
ForestVis is a web-based 3D visualization system for the interactive visual exploration of forest data.

In this project, simple, multilingual videos were created to help refugees better understand and give informed consent to research participation.
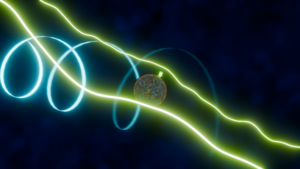
The research group led by Ilaria Testa (KTH, SciLife Lab) has developed a novel method for measuring the rotation of molecules in a solution.
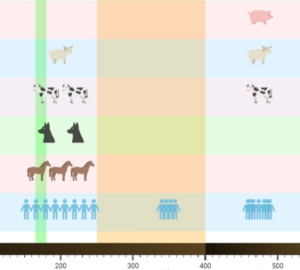
Human-Timeline is an interactive React and PlotlyJS application that visualizes the coevolution of human culture , diverse life species and environmental factors across vast timescales. Inspired by SIMILE’s TimePlot and TimeLine patterns, it combines stacked timelines with dual-axis plots so users can see discrete events, continuous measurements, and contextual periods in one place.
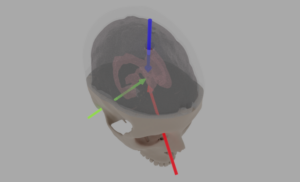
Brain surgery requires extreme precision, which makes realistic training essential. This project was created to improve practice conditions for a procedure where a catheter is inserted into the brain’s ventricles to relieve fluid buildup. The training setup uses a 3D‑printed skull and a Jello‑based artificial brain that mimics real tissue. InfraVis contributed by redesigning and producing key 3D‑printed components, developing scaffolds to hold the brain model securely, and creating lightweight motion‑capture attachments for tracking skull and catheter movements. InfraVis also supported the design of a replaceable membrane that simulates the moment of puncturing ventricle tissue, enabling more accurate and repeatable training.

