VIAMD (Visual Interactive Analysis of Molecular Dynamics)
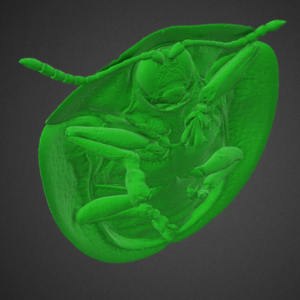
VIAMD (Visual Interactive Analysis of Molecular Dynamics) is an innovative open-source software designed to enhance and streamline the analysis of molecular dynamics (MD) simulations.
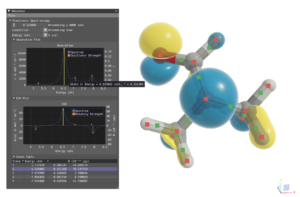
VIAMD (Visual Interactive Analysis of Molecular Dynamics) is an innovative open-source software designed to enhance and streamline the analysis of molecular dynamics (MD) simulations.
InfraVis Call For Visualization Support is open throughout October 2026.
Welcome with your application!
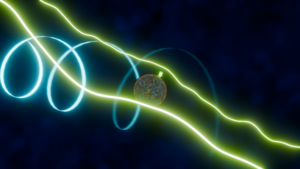
The research group led by Ilaria Testa (KTH, SciLife Lab) has developed a novel method for measuring the rotation of molecules in a solution.
Making research accessible through visual stories, training, workshops, and public events. This expands access to science, deepens understanding, and strengthens the role of research in society.
Cross‑disciplinary visualization that opens new scientific frontiers by making otherwise unattainable insights possible.

Visualizations that transform complex data in the humanities and social sciences into analytical insight, enabling deeper interpretation and supporting new, data‑driven research approaches.

Tools that transform climate and environmental data into evidence‑based insight. This supports policy, strategic decisions, and sustainability planning.
National access to advanced visualization for data‑intensive medical research. Researchers gain hands‑on access to distributed expertise to interpret complex data, develop visual analysis methods, and generate insight with direct clinical relevance
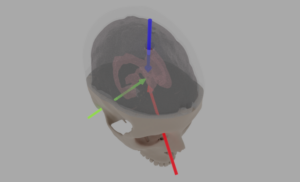
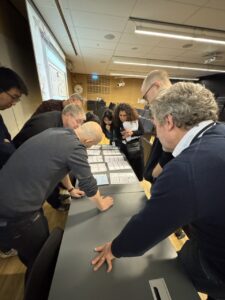
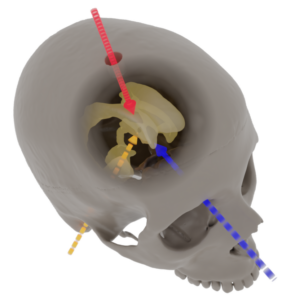
Brain surgery requires extreme precision, which makes realistic training essential. This project was created to improve practice conditions for a procedure where a catheter is inserted into the brain’s ventricles to relieve fluid buildup. The training setup uses a 3D‑printed skull and a Jello‑based artificial brain that mimics real tissue. InfraVis contributed by redesigning and producing key 3D‑printed components, developing scaffolds to hold the brain model securely, and creating lightweight motion‑capture attachments for tracking skull and catheter movements. InfraVis also supported the design of a replaceable membrane that simulates the moment of puncturing ventricle tissue, enabling more accurate and repeatable training.
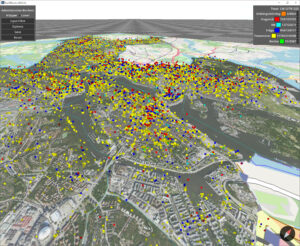
This project focused on crowd sourced urban data collected from Tyck Till an app developed by Stockholms Stad where users can leave feedback and report errors in the city. The data contains approximately 800 000 georeferenced reports in various categories. The goal of this project was to facilitate interactive exploration of this data through filtering and navigation.