Our Impact: Society & Culture
Visualizations that transform complex data in the humanities and social sciences into analytical insight. This enables deeper interpretation and supports new, data‑driven research approaches.
-
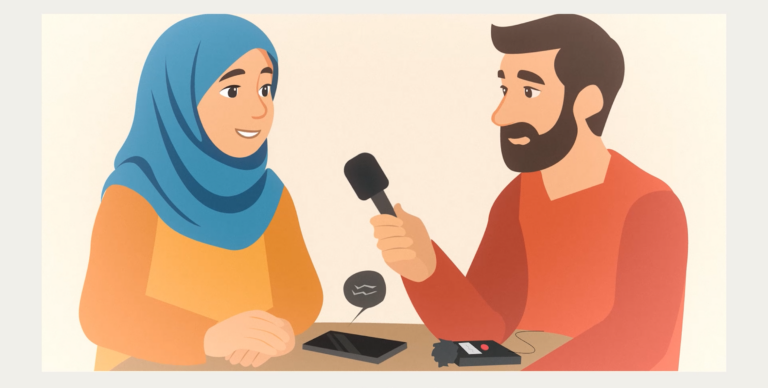
Consent forms for people with limited previous education
In this project, simple, multilingual videos were created to help refugees better understand and give informed consent to research participation.
-
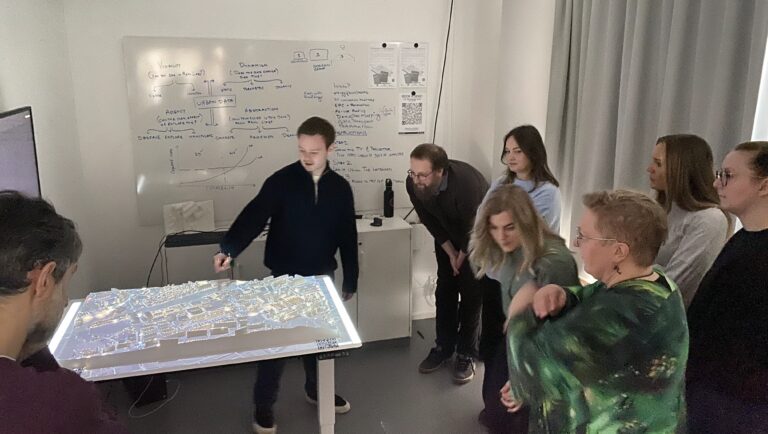
Digital Twin Cities – visualizing the future
Urban planning is complex, and rising water levels due to climate change add further challenges.
-
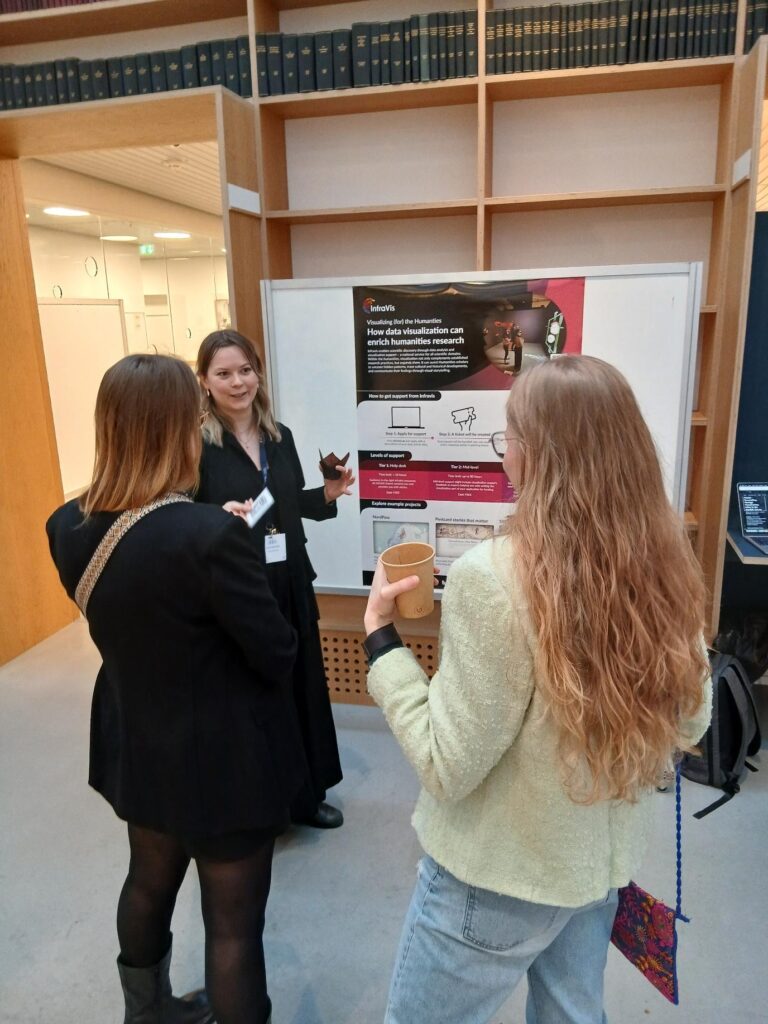
InfraVis Presented at DHNB: Digital Humanities in the Nordic and Baltic Countries
How do digital humanities researchers work with large and complex datasets? At the DHNB: Digital Humanities in the Nordic and Baltic Countries 2026 conference…
-
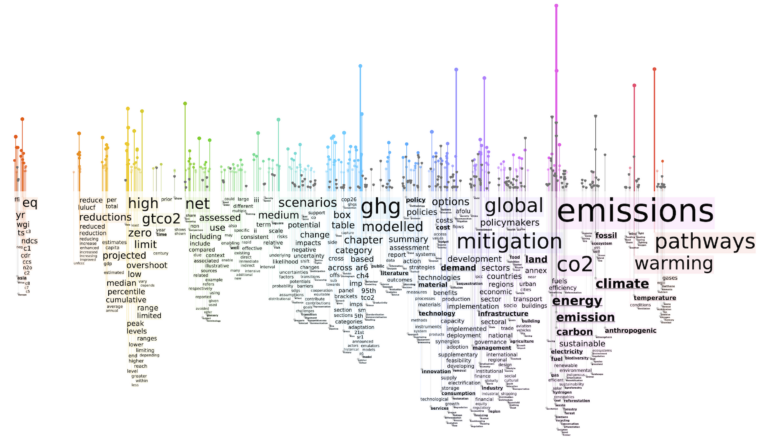
Workshop: Word Rains and Word Clouds
Welcome to this free and open hybrid workshop that aims at bringing together developers and researchers, primarily from the humanities, with an interest in…
-
InfraVis Presented at DHNB: Digital Humanities in the Nordic and Baltic Countries
How do digital humanities researchers work with large and complex datasets? At the DHNB: Digital Humanities in the Nordic and Baltic Countries 2026 conference…
-
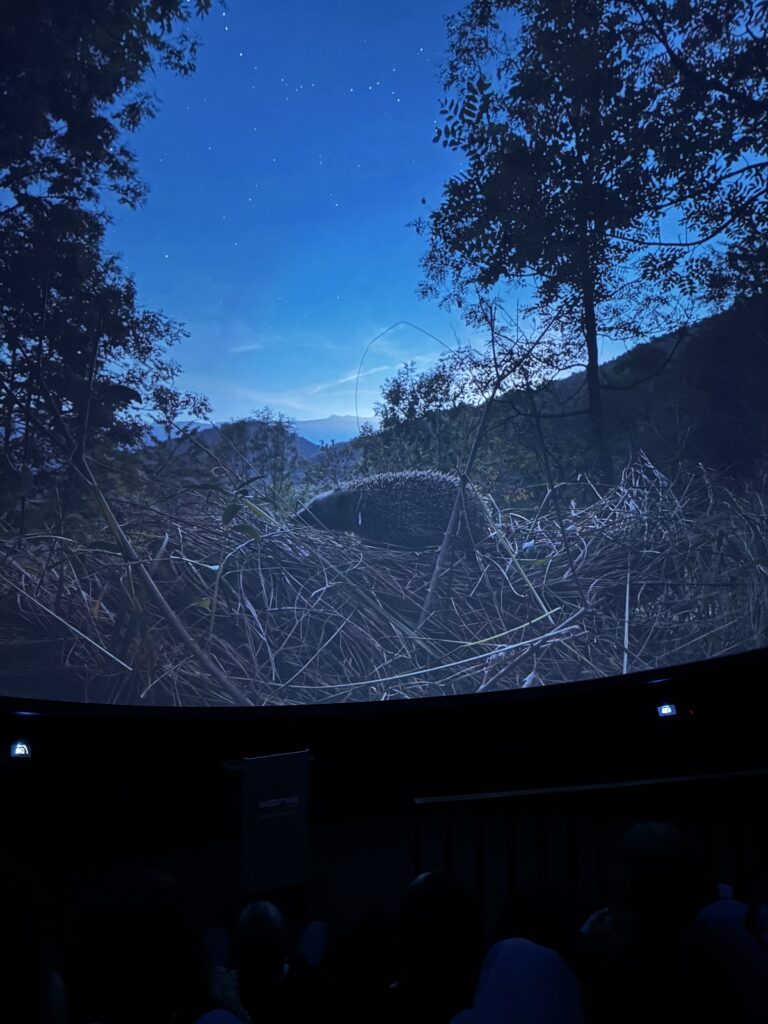
InfraVis at the Industry Premiere of Darkness Matters
InfraVis recently joined the industry premiere of the dome film Darkness Matters by Costanza Julia Bani at m:brane in Malmö. InfraVis contributed to the…
-
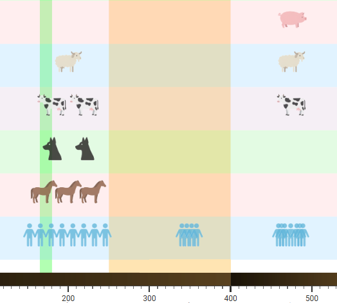
Human Timeline
Human-Timeline is an interactive React and PlotlyJS application that visualizes the coevolution of human culture , diverse life species and environmental factors across vast…
-
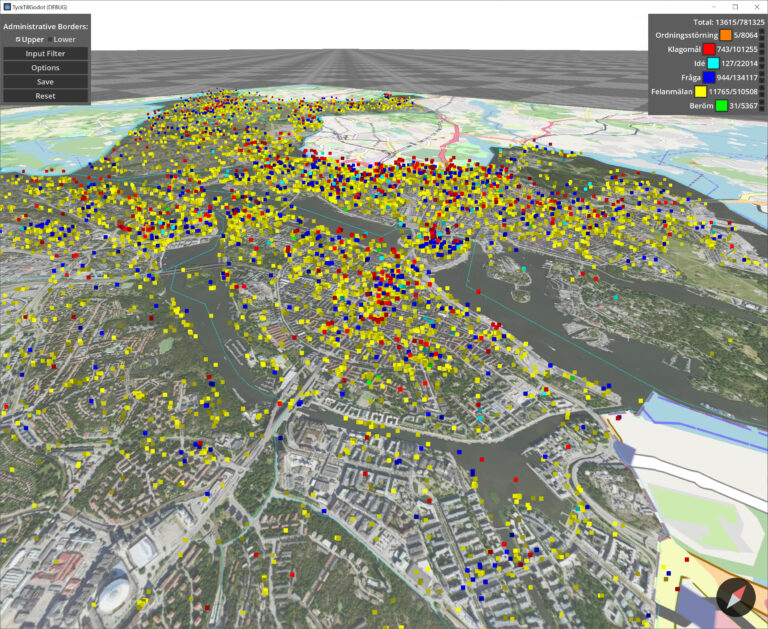
Interactive visualization of crowd sourced urban data from Tyck Till
This project focused on crowd sourced urban data collected from Tyck Till an app developed by Stockholms Stad where users can leave feedback and…
-
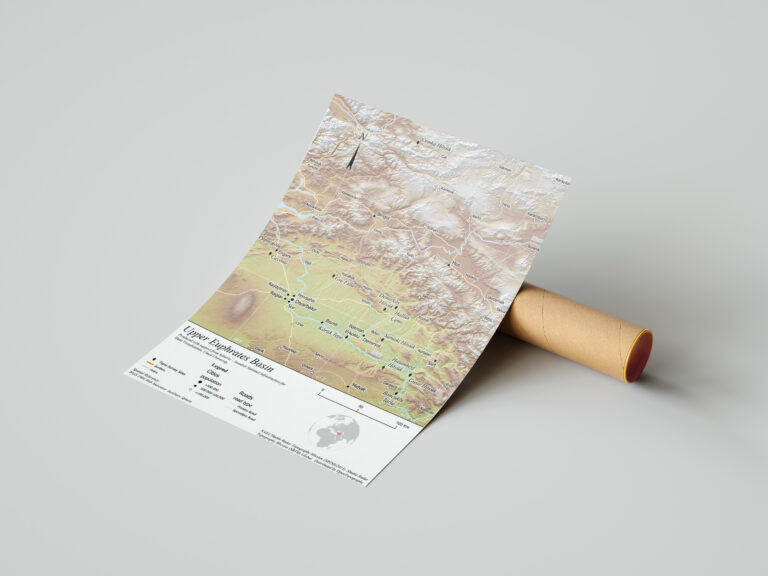
GIS visualization of archaeological sites in the upper Tigris and Euphrates River basins
The project produced GIS-based maps and diagrams to visualize archaeological sites and material culture, highlighting the regional shift from hunting-gathering to farming. It integrates…
-
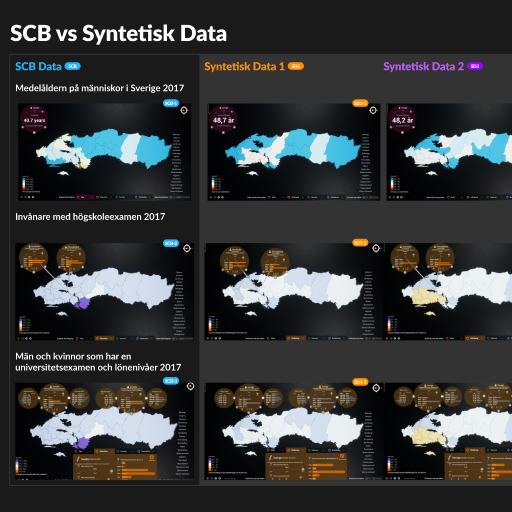
Synthetic Sweden – Exploring applications and limitations of synthetic demographic data
The goal of this project was to introduce synthetic demographic data to a public audience through an extension of the existing “Sweden-in-Numbers” installation.
-
-
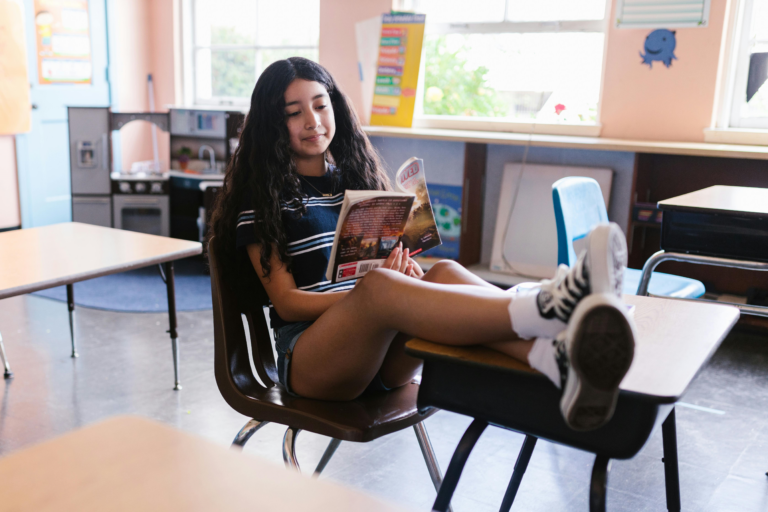
Visualizing Literacy of Children in School
This project explores ways of visualizing data concerning the literacy metrics of elementary school children in Sweden, collected using a sophisticated tool developed for…