
Our Impact: Science & Discovery
Cross‑disciplinary visualization that opens new scientific frontiers by making otherwise unattainable insights possible.
-
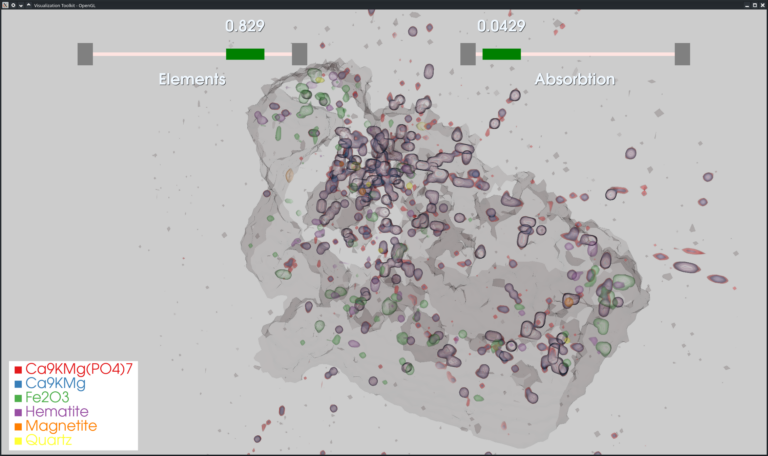
Advanced Visualization for Nutrient Recovery
Searching for phosphates in tiny particles of dust and soot, using advanced visualizations and data analysis of volume slices from XRF uCT scans.
-

CT Sinogram Visualiser
InfraVis helped develop a real-time visualization tool for complex CT scan data (sinograms), allowing researchers to spot measurement issues early, identify areas of interest,…
-

VIAMD (Visual Interactive Analysis of Molecular Dynamics)
VIAMD (Visual Interactive Analysis of Molecular Dynamics) is an innovative open-source software designed to enhance and streamline the analysis of molecular dynamics (MD) simulations.
-

New Interreg funding for data-driven research and innovation
We are delighted to share that DataCatalyst Öresund has been approved through Interreg Öresund-Kattegat-Skagerrak. The project brings together Lund University, DTU – Technical University…
-

Visualizing physical interactions of molecules in macromolecular scale
The research group led by Ilaria Testa (KTH, SciLife Lab) has developed a novel method for measuring the rotation of molecules in a solution.
-
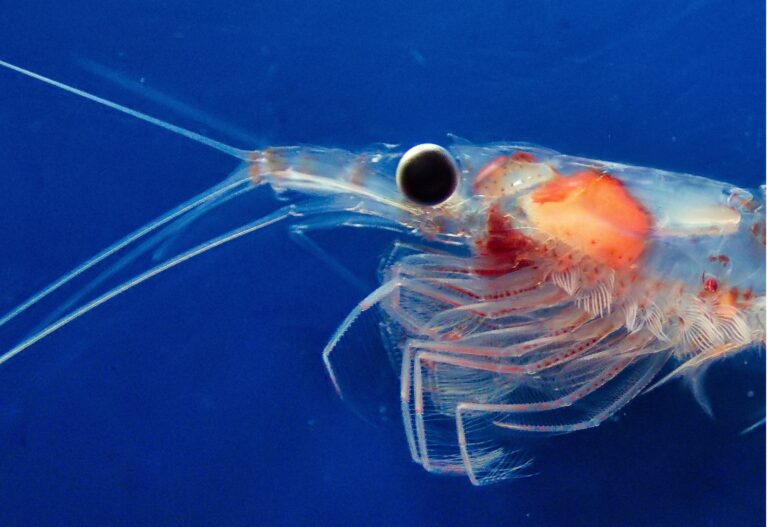
GenomeLens
The aim of the project is to produce the novel interactive tool “GenomeLens”, that uses genome sequencing data to visualize genetic variation along chromosomes…
-
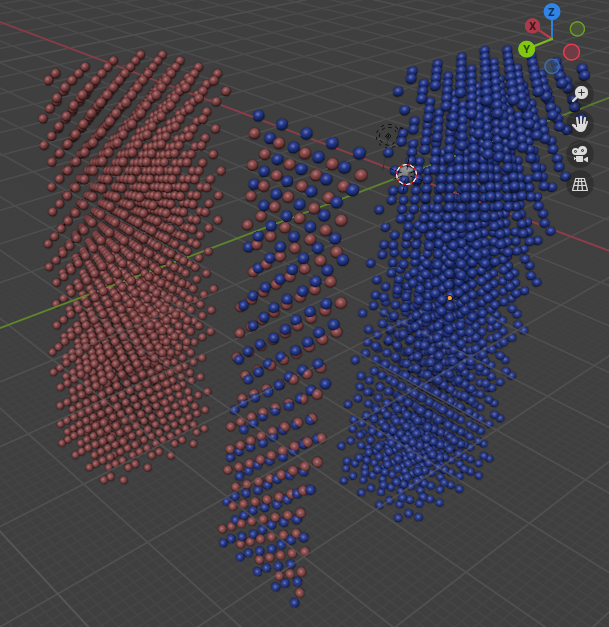
Visualization of incommensurately modulated structures on example of allotropes of bromine at high pressures
This project developed a specialized 3D visualization tool to explore how halogen crystal structures transform under extreme pressure, particularly focusing on incommensurately modulated structures…
-

Constructing a virtual Synchrotron X-ray beamline
Researchers from InfraVis and MAX IV are developing virtual environments from CAD drawings for education, training, and virtual experiments. Using Blender and Unreal Engine…
-

InfraVis identified as key to Unlocking Data Potential at facilities like MAX IV and ESS
The recent Swedish Research Council report, Bottlenecks that Delay the Benefits of Large-Scale Research Infrastructure, highlights data management, analysis, and visualization as major challenges…
-
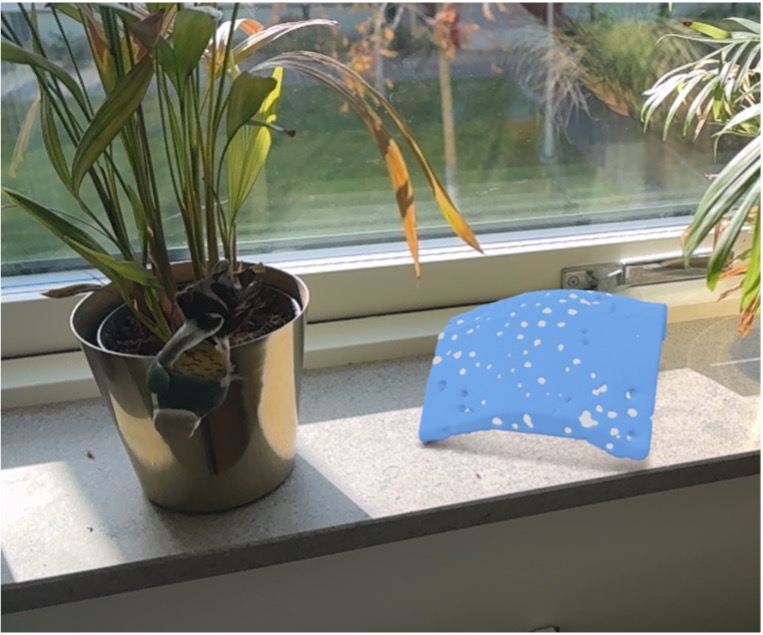
Inspecting tomographic datasets and Protein Data Base files in Augmented Reality – the perfect tool for an immersive poster session
The InfraVis node at Lund University has developed an application and workflow to visualize tomographic datasets in the immersive CAVE system at the Virtual…
-
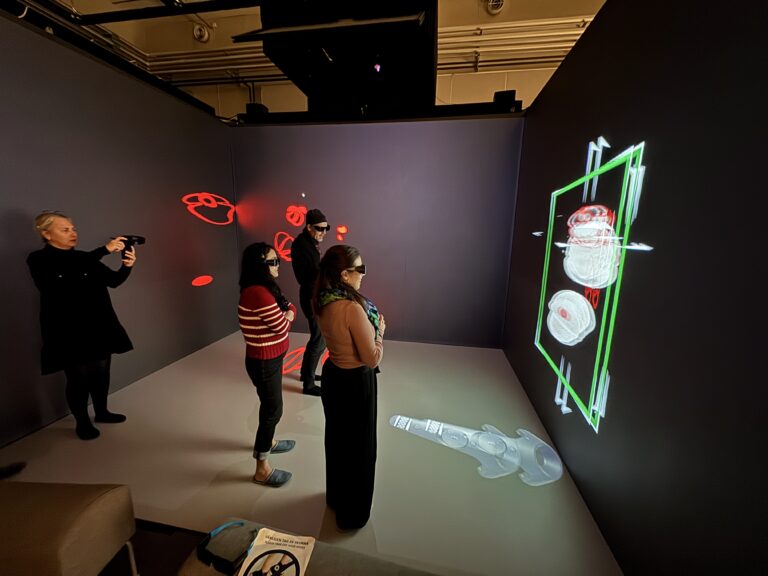
Volume and slice visualization in the CAVE at LTH’s VR lab
The InfraVis node at Lund University has developed an application and workflow to visualize tomographic datasets in the immersive CAVE system at the Virtual…
-
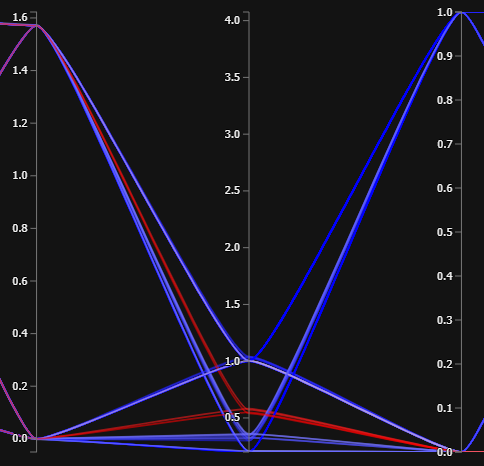
Dynamically Visualizing high-dimensional datasets using parallel coordinates plot
Displaying many dimensions of a dataset simultaneously presents its set of challenges. One way of going about dealing with these challenges is to present…