
CT Sinogram Visualiser
InfraVis User
Ozan Öktem
Oualid Burström
InfraVis Application Expert
Julius Häger (KTH)
InfraVis Node Coordinator
Björn Thuresson (KTH)
Tools & Skills
Slicer, 3D reconstruction, Docker
Keywords
Computer Tomography
Background
Through the InfraVis Call 2025 we received a request from Ozan Öktem and Oualid Burström to further develop a tool for visualizing sinograms. A sinogram is the raw data obtained by a computed tomography (CT) scanner as it scans a subject. By spinning an x-ray source and x-ray detector around a subject and taking, effectively, many x-ray images from different angles it is possible to reconstruct a cross section of the subject. Typical CT scanners have a 1-dimensional detector, either a flat line of sensors or a line of sensors curved in a circle around the subject. This makes it easy to visualize as you can stack these images to create a 2D sinogram that can easily be displayed as a 2D image. For 2D sensors this is no longer possible as the sinogram now has 3 dimensions. This is where this project starts as InfraVis was asked to help develop a real-time visualization solution for these kinds of sinograms. Seeing these raw sinograms would allow researchers to see issues with the measurements long before running an expensive reconstruction algorithm which could take hours to complete and could also help researchers detect interesting regions and only reconstruct these regions of interest. Making it possible to use the plugin while developing new reconstruction methods was also a goal for the project.
The Implementation
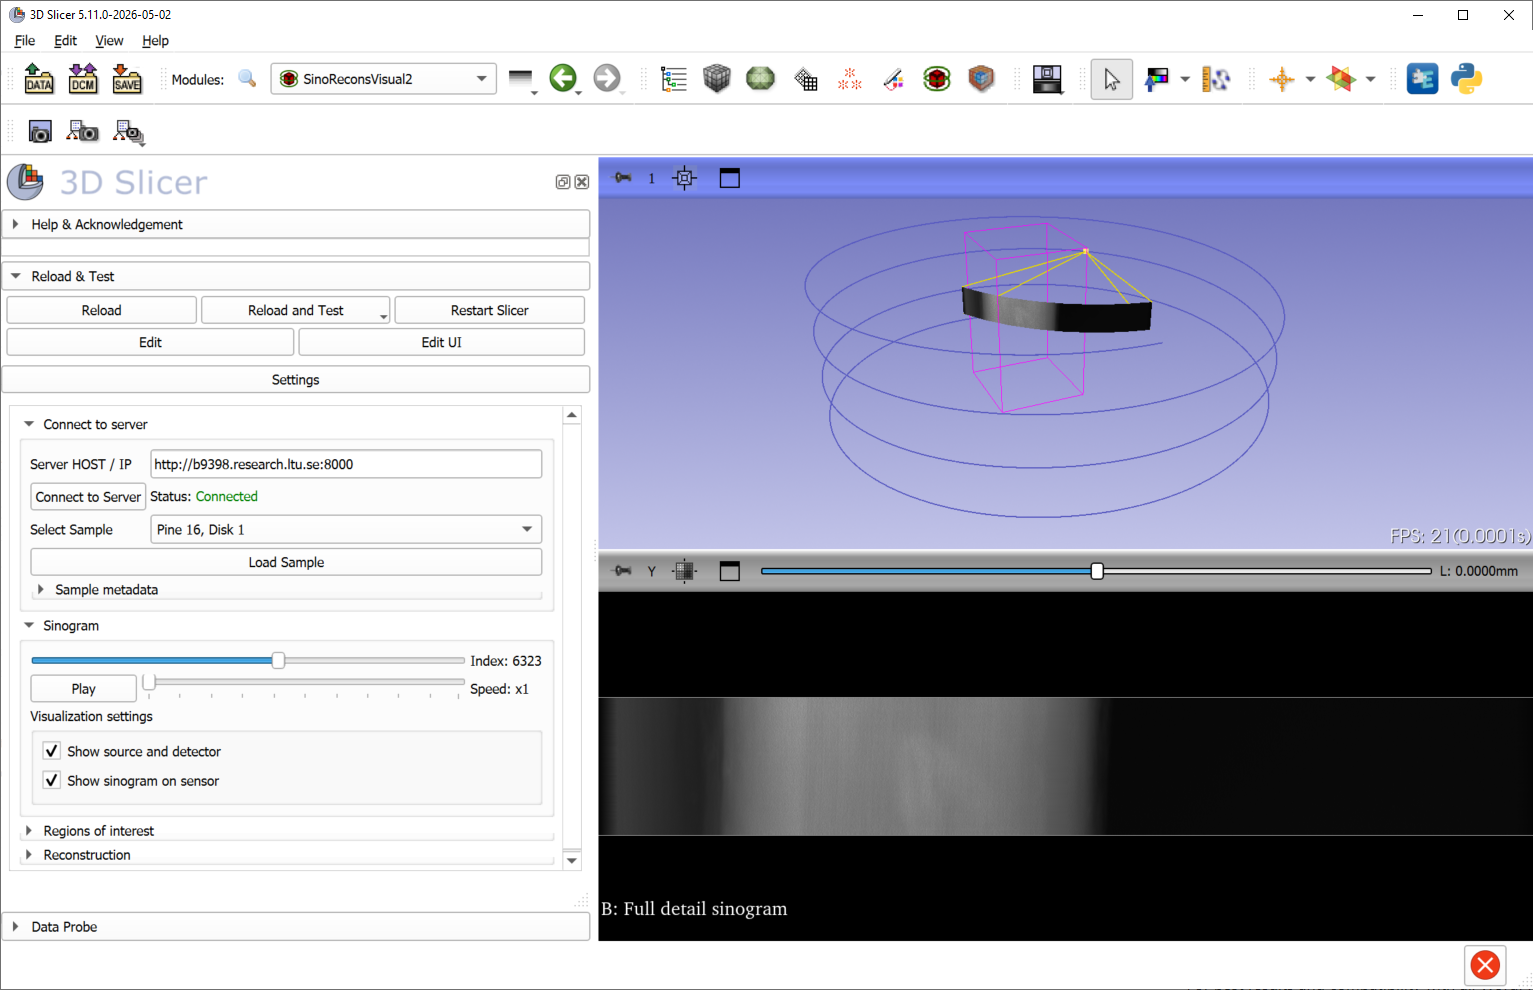
An existing start, a slicer plugin as well as an accompanying server software using Docker, was provided to InfraVis. The plugin could show individual x-ray images and a schematic view of the acquisition geometry, but generally the plugin was slow and didn’t offer much help in validating if there were problems with the data. Being able to interactively scrub through the x-ray images and interactively see it in the context of the acquisition geometry would allow users to quickly identify problems in the sinogram data itself or detect if there is a geometry mismatch where metadata described geometry doesn’t match the measured data.
Live scrubbing though the sinogram data highlighting a knot in a scanned log.
To make a real-time display of the sinogram data a lot of compression is necessary. A typical sinogram in the dataset used for the project contains around 11000 x-ray images, around 16 GBs of data. In general, sinograms can be many times larger, hundreds of gigabytes in size. Storing this data on the user’s computer is not feasible so streaming the data directly from disk is not an option. Instead, we need to stream the data from a server over a network, which is much slower than a hard drive. To make this possible we compress the x-ray images using efficient image formats like JPEG2000 or AVIF which can achieve a compression ratio of 98.4% while retaining acceptable quality for scrubbing. This reduces the size of the dataset that needs to be streamed from 1.5MB per image to around 22KB per image. As soon as the user stops scrubbing the full resolution x-ray image is seamlessly downloaded to be inspected in full detail.
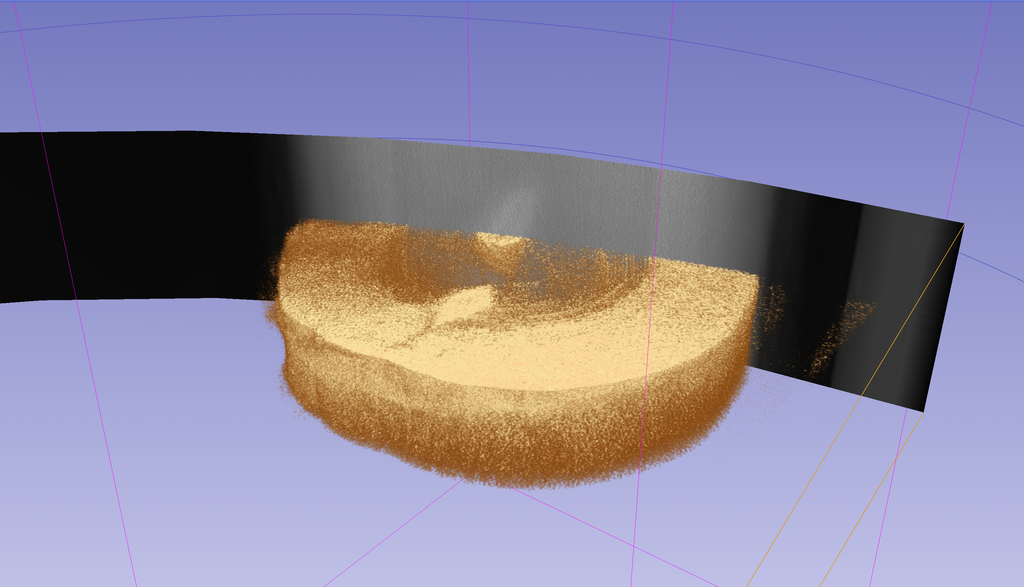
The sinogram is also at the same time displayed on the detector geometry in the schematic acquisition 3D geometry. This makes it easier to spot mismatches in recorded geometry and measurement. It also makes it easier to detect and define regions of interest. Because running reconstruction algorithms on the data can take a long time and use a lot of memory it’s often good to only reconstruct the part of the data you are interested in looking at. To do this the plugin allows the user to define regions of interest areas and sinogram subsets that can then be used to run reconstruction on only a small part of the data itself. This makes it much easier to get a reconstruction of only the interesting part of the sinogram, saving time and computation.
Video of sinogram being shown on detector geometry showing a match between the 3D reconstruction and the 2D sinogram. Looking carefully at the sinogram the knot in the reconstructed log can be seen to match.
The plugin and server support running a few typical reconstruction algorithms like filtered back-projection or Landweber iteration. But importantly the server and plugin can very easily be modified to support new reconstruction algorithms which are useful for developing new algorithms. To aid adoption of the tool, proper documentation and a user guide have been produced. So, setting up a server with synthetic data and getting slicer plugin installed and implementing a new reconstruction method is very simple.
Conclusion
The tool is being presented in the 22nd Annual Meeting of the Northern European Network for Wood Science and Engineering by Oualid Burström. In the future it data-loaders for other data formats than the one used for this project could be developed to help other labs inspect their raw CT data.
The plugin is available open source here: https://github.com/ouaburst/CT_GUI_Docker