
Advanced Visualization for Nutrient Recovery
InfraVis User
Anna Strandberg (UmU)
InfraVis Application Expert
Ingemar Markström (KTH)
InfraVis Node Coordinator
Björn Thuresson (KTH)
Tools & Skills
Python, VTK, X-ray Florescence, Volume rendering, Data analysis
Open Data
N/A
Background
X-ray Difractogram uCT scanners can help us peer into the tiniest of small particles. The research behind this project investigates the posibility to recover specific elements out of particles derived from nutrient rich sources. One such category of element in particular are phosphates, which are both a critical eleöment in a positive way enabling growth in the fields, and when out of and over balance, triggers overgrowth, algal blooms and oxygen depletion in our waters and lakes. Understanding how phosphates are geometricaly stored and locked into crystaline structures in particles is where this project takes off.
When hit with X-rays, molecules start vibrating, gets excited into a higher energy state, and then radiates the excess energy back out again. Every molecule carries its own unique fingerprint in the spectrogram, which is then used when identifying what has been scanned. The very interesting detail in this project is that the XRDF-scanner here used is able to bombard and scan such small particles as grains of dust and soot with X-rays, and the data from these scans is not only an overall spectrum of the particle, but instead a high resolution cross sectional volume, which can then be analyzed on a micro scale. The research team at Umeå were in need of such a tool.
Project Details
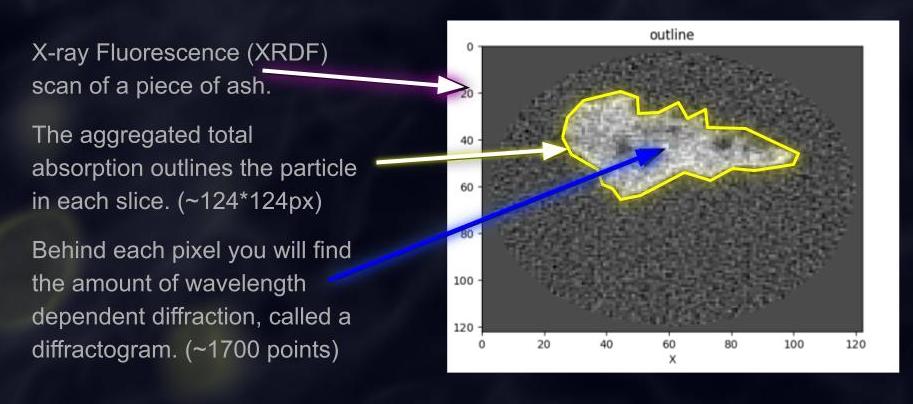
As seen in the image above, the absorption outline for one slice is clearly visible. Unfortunately this is not enough to distinguish anything else than that there is a matter here. However, hidden behind each and every pixel are the important and interesting driffractograms, captured from that small volume of 3D space.
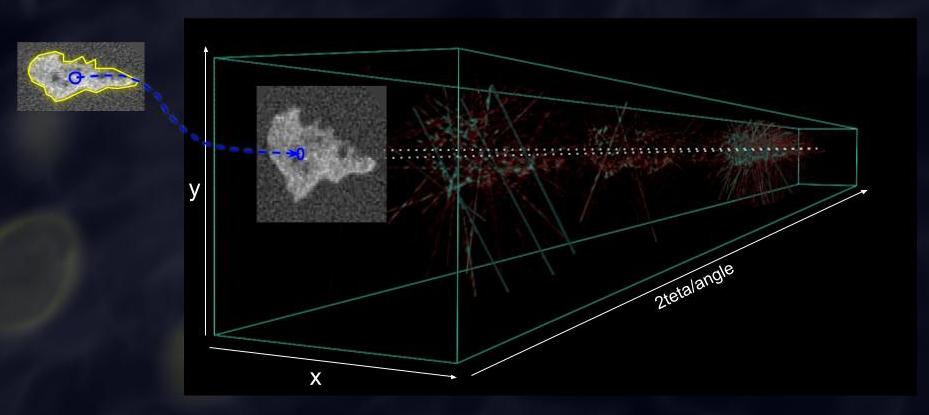
Seen in the image above is a visualization of the whole diffractogram for the slice. When now extracting one single pixel from this volume, we get the following:
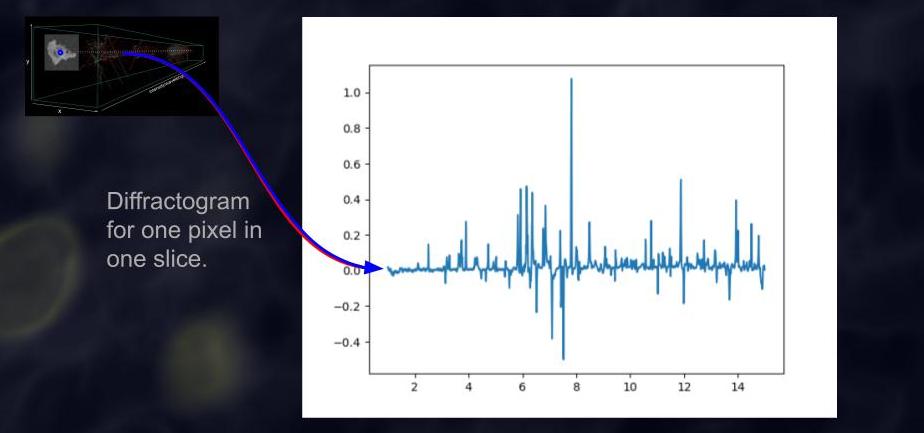
This pixel (which represents one (x,y,z) coordinate in the ash particle) presents the diffractographic fingerprint seen in the blue line graph above.
Thanks to simulations of molecules, a theoretical fingerprint can be created from molecular structures. The file format used in this project was the Crystallographic Information File format, short as CIF-files, which contain, among other details, atom coordinates and structures. The task was to now figure out where (if anywhere in the diffractogram) the different elements were located in each slice, by comparing the diffractogram of each pixel to the calculated diffractograms from cif-files of the looked-for elements. The resulting tool is seen below.
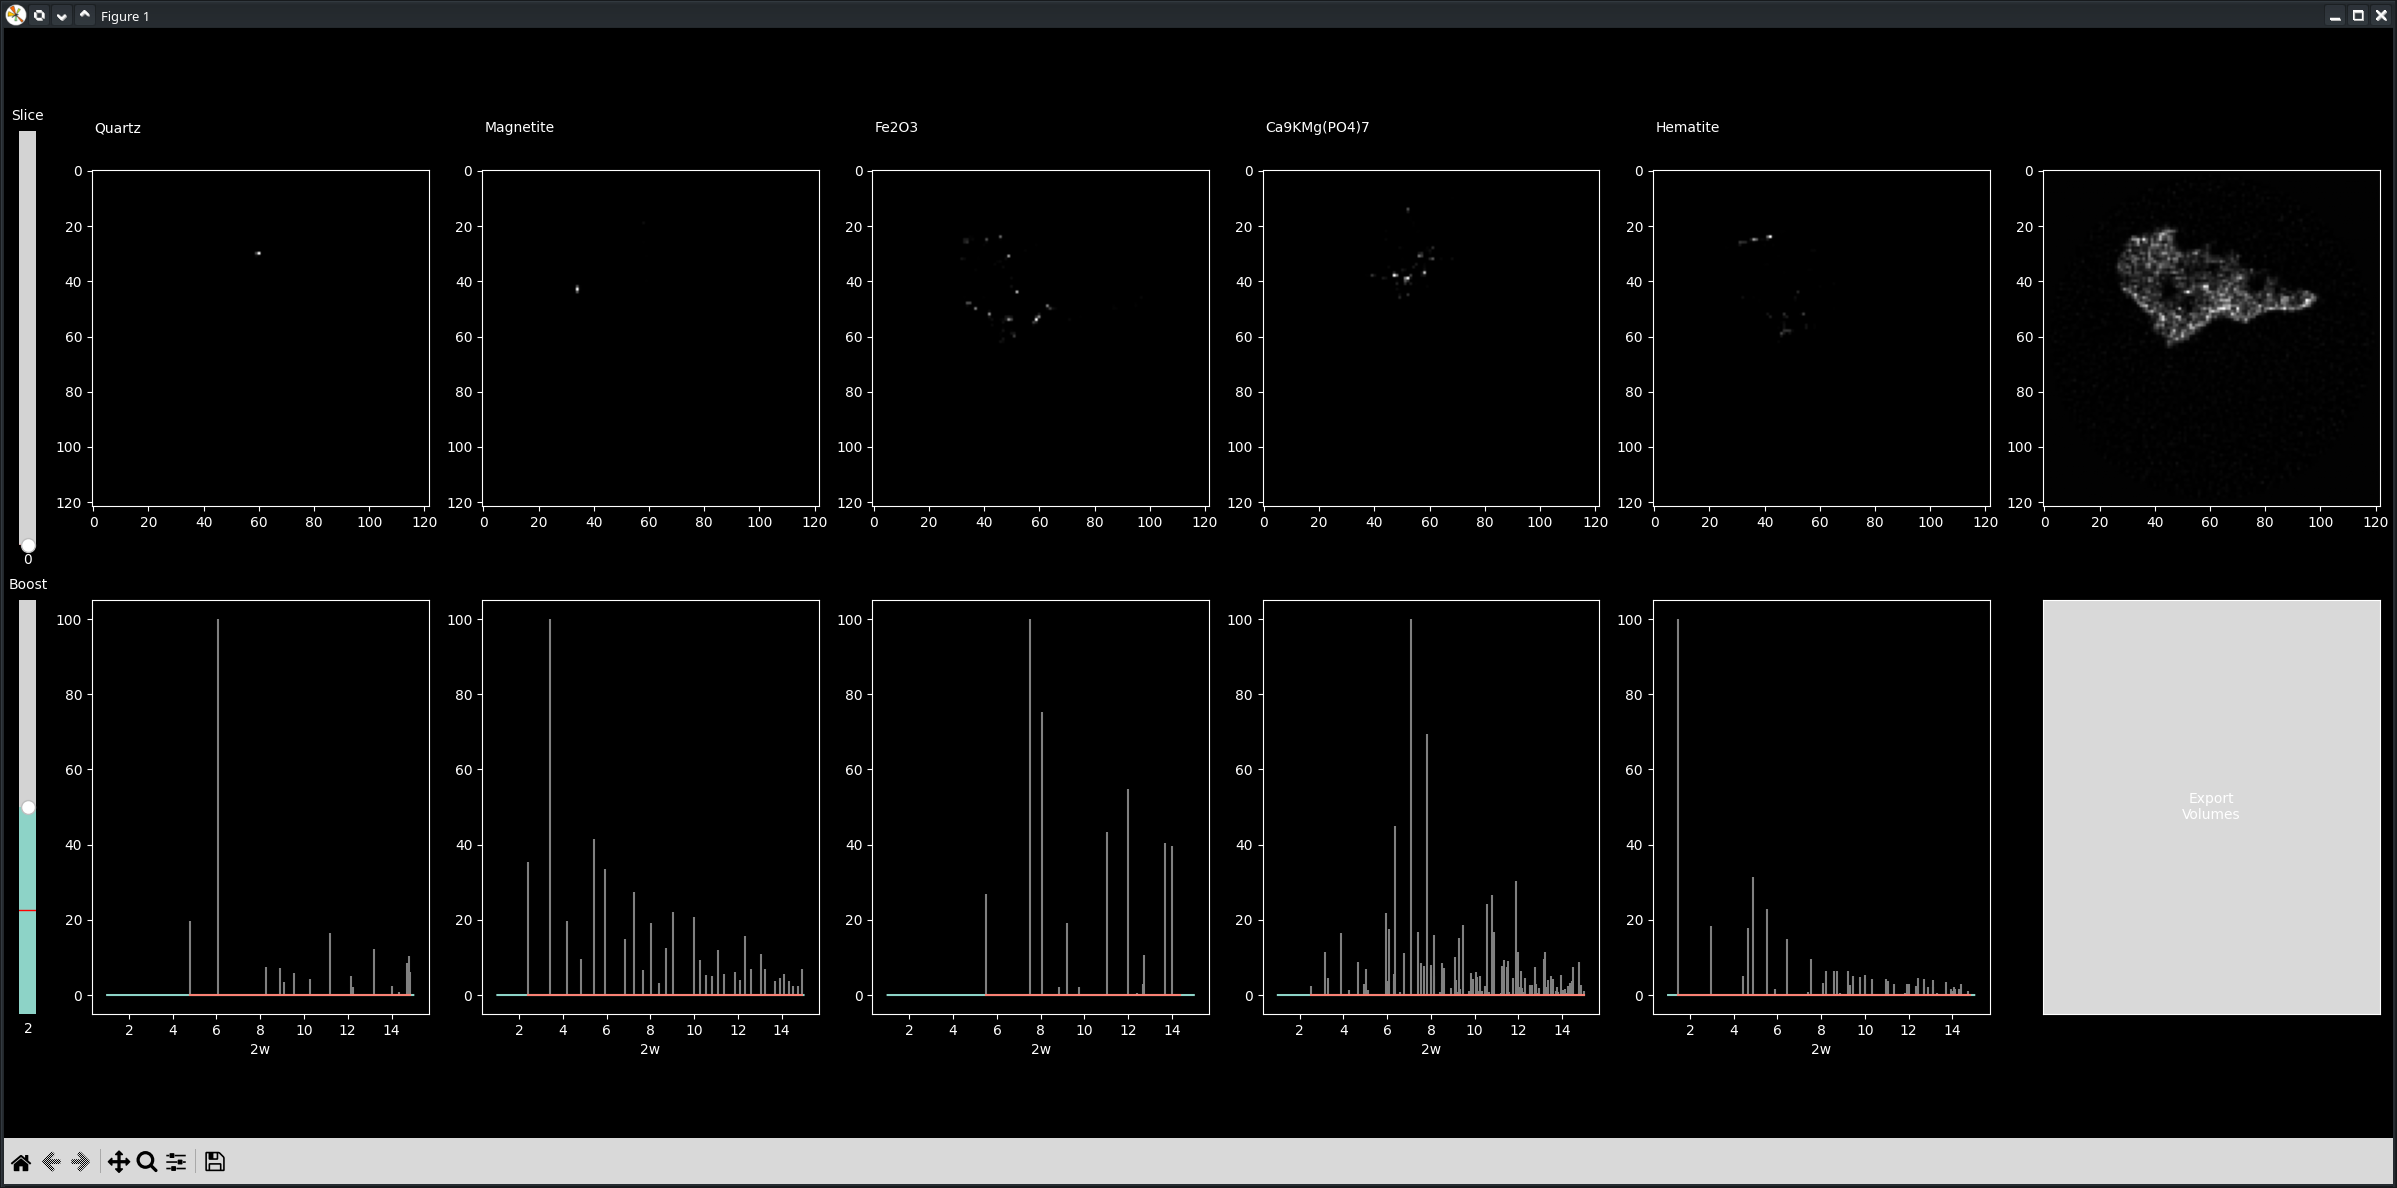
Here we can clearly see that in this slice, there is one speckle of quartz, some Hematite, and most importantly there is some speckles of Calcium phosphate. But, we were not done yet. So, when happy with the resolution of the analysis, the tool exports each element as a separate volume, along with the absorption.
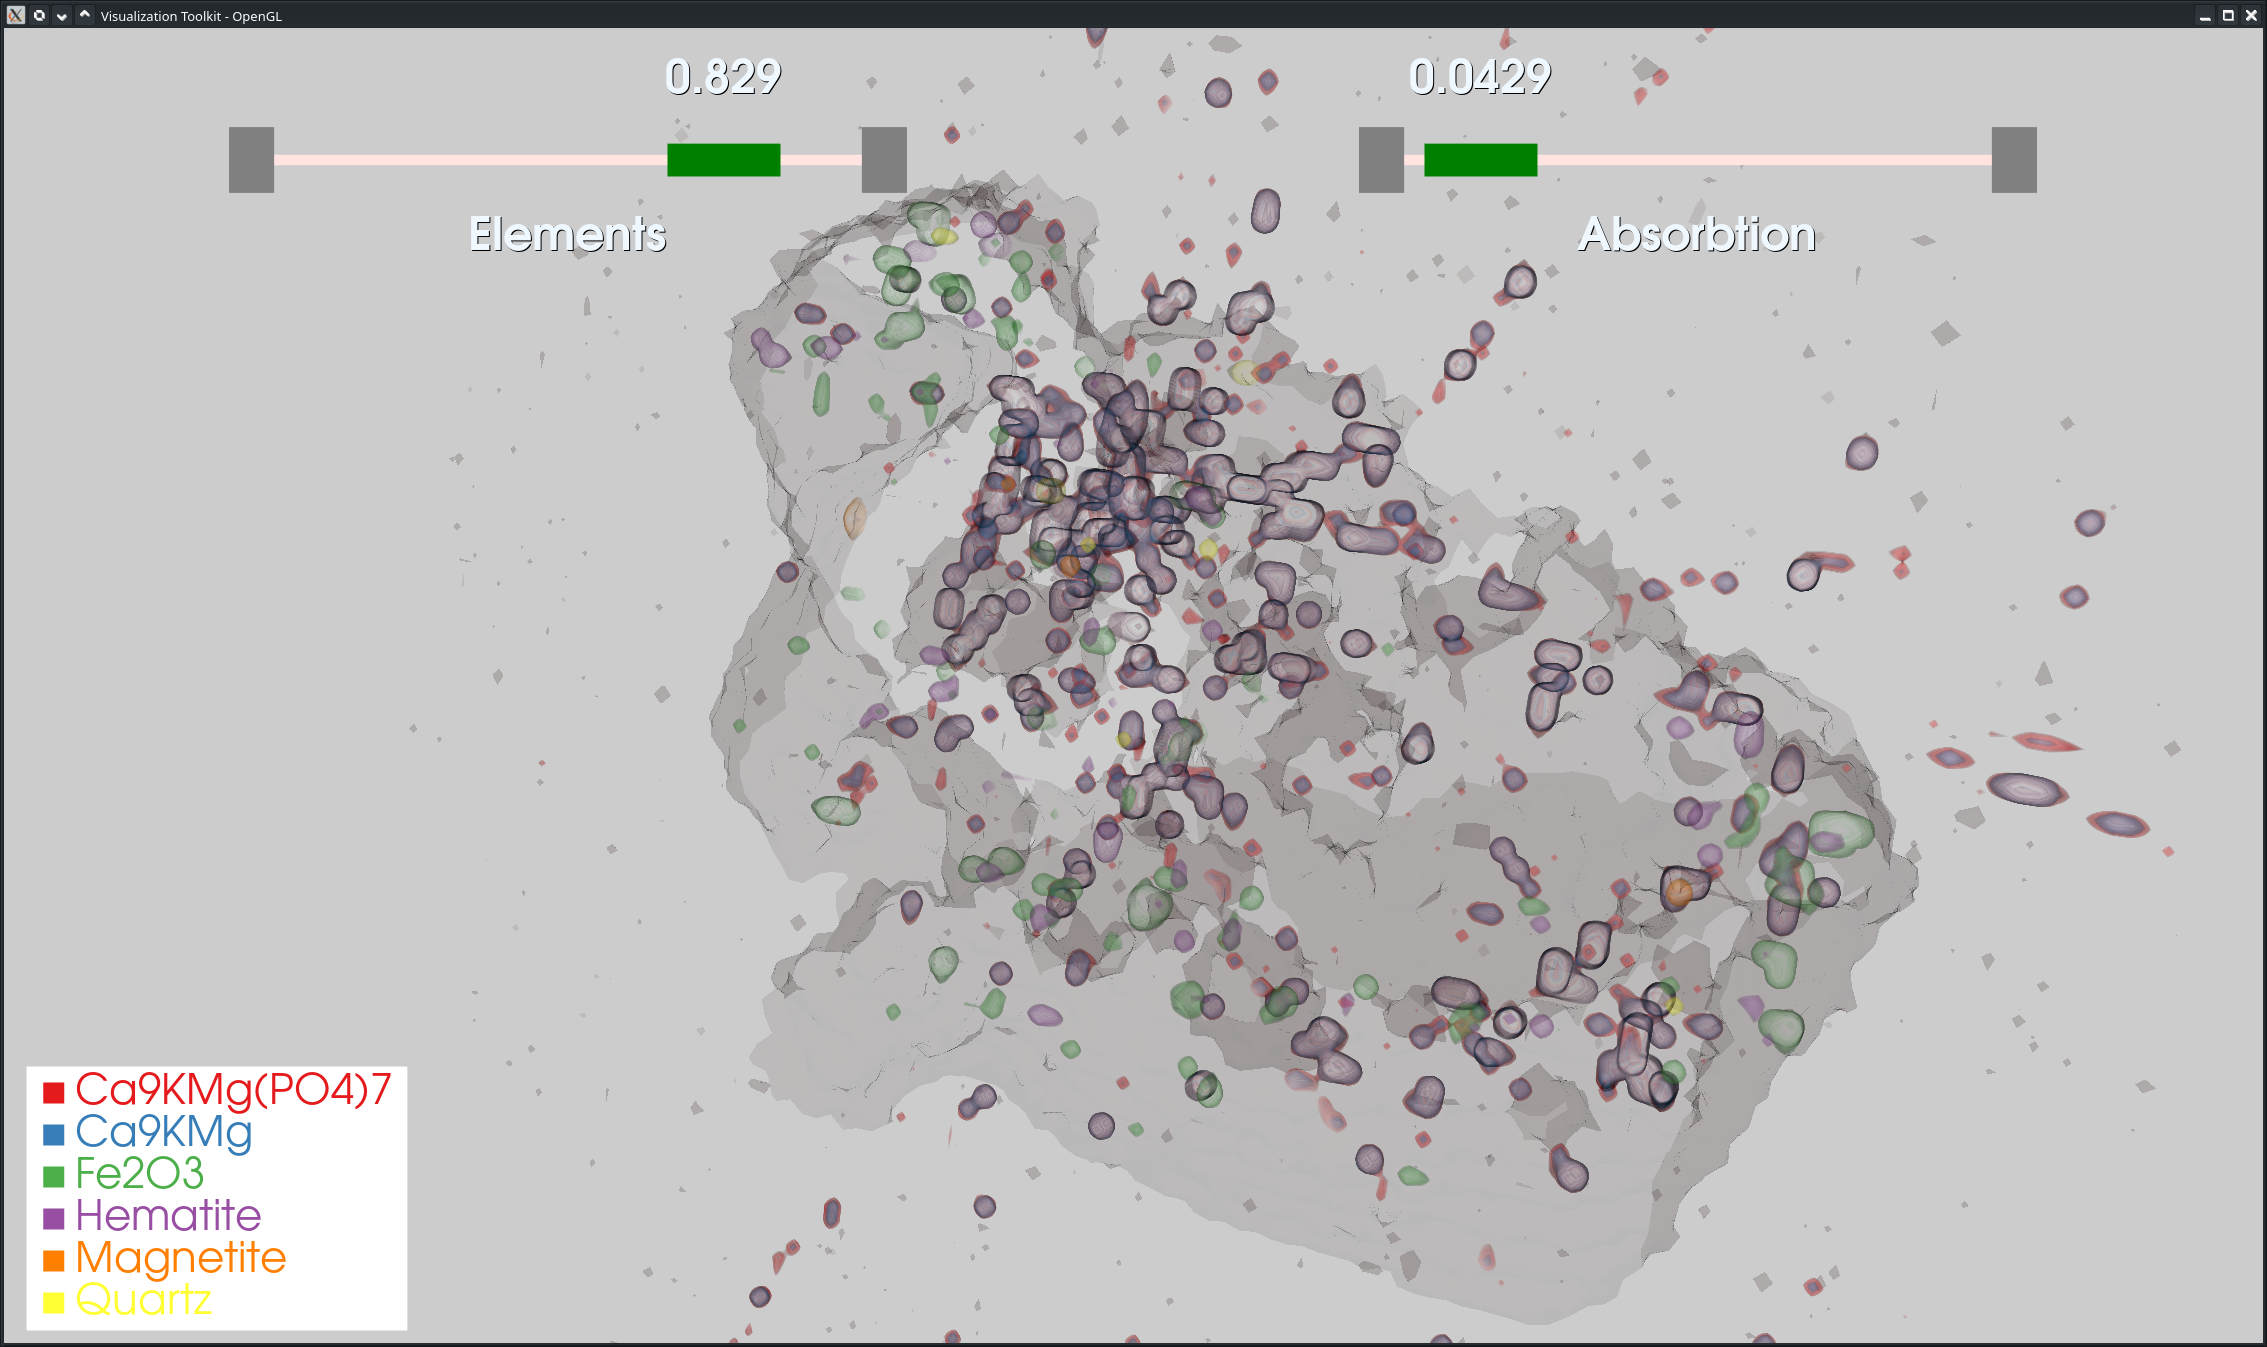
The exported volumes can then be viewed with the built in volume renderer. The volumes can of course be imported into any dedicated and more capable volume rendering software such as Inviwo or Paraview, but quickly being able to verify the results of the analysis was deemed a reasonable thing to implement.