Consent forms for people with limited previous education
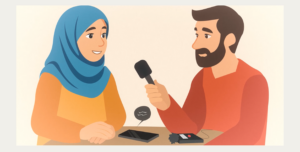
In this project, simple, multilingual videos were created to help refugees better understand and give informed consent to research participation.
In this project, simple, multilingual videos were created to help refugees better understand and give informed consent to research participation.
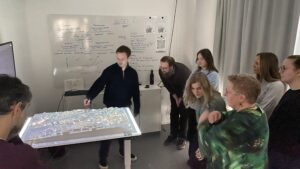
Urban planning is complex, and rising water levels due to climate change add further challenges.
How do digital humanities researchers work with large and complex datasets?
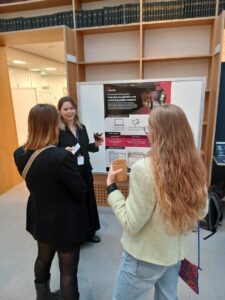
At the DHNB: Digital Humanities in the Nordic and Baltic Countries 2026 conference in March, InfraVis was presented by Linnéa Tjernström and Evelina Liliequist (both from the Umeå University node at Humlab) at Aarhus University through a poster and lightning talk.
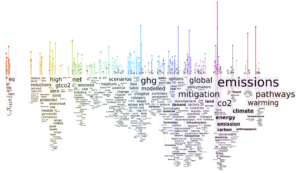
Welcome to this free and open hybrid workshop that aims at bringing together developers and researchers, primarily from the humanities, with an interest in using text visualization for exploring texts.
How do digital humanities researchers work with large and complex datasets?
At the DHNB: Digital Humanities in the Nordic and Baltic Countries 2026 conference in March, InfraVis was presented by Linnéa Tjernström and Evelina Liliequist (both from the Umeå University node at Humlab) at Aarhus University through a poster and lightning talk.
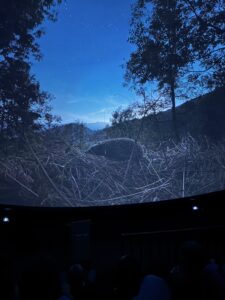
InfraVis recently joined the industry premiere of the dome film Darkness Matters by Costanza Julia Bani at m:brane in Malmö. InfraVis contributed to the production through Julius Häger, who provided precise measurements of light pollution at several specific locations.
Human-Timeline is an interactive React and PlotlyJS application that visualizes the coevolution of human culture , diverse life species and environmental factors across vast timescales. Inspired by SIMILE’s TimePlot and TimeLine patterns, it combines stacked timelines with dual-axis plots so users can see discrete events, continuous measurements, and contextual periods in one place.
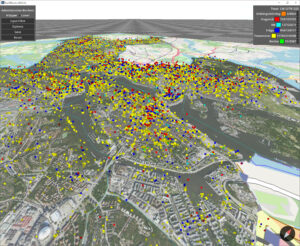
This project focused on crowd sourced urban data collected from Tyck Till an app developed by Stockholms Stad where users can leave feedback and report errors in the city. The data contains approximately 800 000 georeferenced reports in various categories. The goal of this project was to facilitate interactive exploration of this data through filtering and navigation.
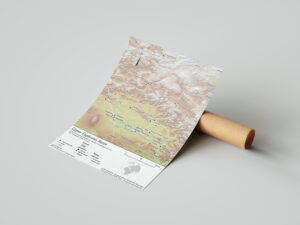
The project produced GIS-based maps and diagrams to visualize archaeological sites and material culture, highlighting the regional shift from hunting-gathering to farming. It integrates environmental and archaeological data to show patterns of human–environment interaction across multiple case study areas and their chronological development.
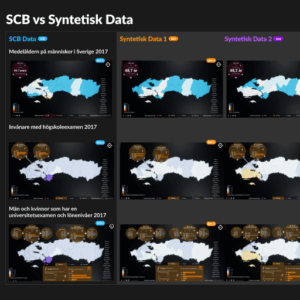
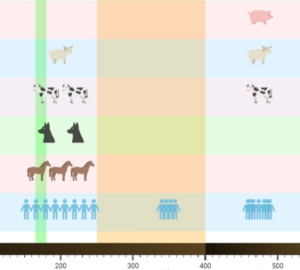
The goal of this project was to introduce synthetic demographic data to a public audience through an extension of the existing “Sweden-in-Numbers” installation.