GenomeLens
The aim of the project is to produce the novel interactive tool “GenomeLens”, that uses genome sequencing data to visualize genetic variation along chromosomes within and between populations.
The aim of the project is to produce the novel interactive tool “GenomeLens”, that uses genome sequencing data to visualize genetic variation along chromosomes within and between populations.
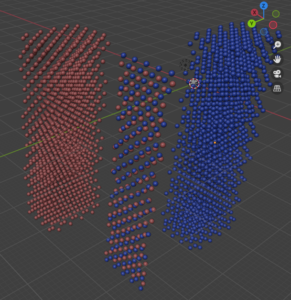
This project developed a specialized 3D visualization tool to explore how halogen crystal structures transform under extreme pressure, particularly focusing on incommensurately modulated structures that emerge during molecular dissociation. By enabling interactive visualization of complex atomic configurations and transitions, the tool helps researchers interpret structural phase changes that are otherwise difficult to analyze using conventional crystallographic methods.
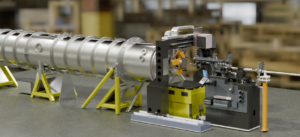
Researchers from InfraVis and MAX IV are developing virtual environments from CAD drawings for education, training, and virtual experiments. Using Blender and Unreal Engine 5, the team optimizes complex geometries for immersive visualization of beamlines like ForMAX at MAX IV. Future work focuses on topology optimization for seamless VR experiences.
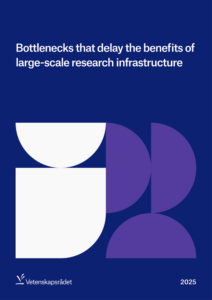
The recent Swedish Research Council report, Bottlenecks that Delay the Benefits of Large-Scale Research Infrastructure, highlights data management, analysis, and visualization as major challenges for researchers. We are honored that InfraVis has been recognized as a key infrastructure in unlocking data potential at facilities like MAX IV and ESS. We look forward to continuing this important work alongside our users.
The InfraVis node at Lund University has developed an application and workflow to visualize tomographic datasets in the immersive CAVE system at the Virtual Reality laboratory at LTH – Faculty of Engineering. The workflow was originally made for the LINXS hackathon SynchroMage: 3D Tomography and Visualisation for Earth’s Hidden Treasures – Environment and Climate theme, but after a positive evaluation from participants, also described in the following LINXS article, we have kept the development going.
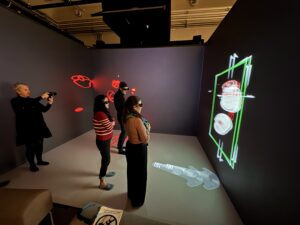
The InfraVis node at Lund University has developed an application and workflow to visualize tomographic datasets in the immersive CAVE system at the Virtual Reality laboratory at LTH – Faculty of Engineering. The workflow was originally made for the LINXS hackathon SynchroMage: 3D Tomography and Visualisation for Earth’s Hidden Treasures – Environment and Climate theme, but after a positive evaluation from participants, also described in the following LINXS article, we have kept the development going.
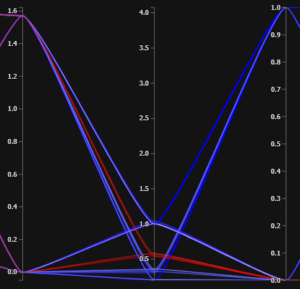
Displaying many dimensions of a dataset simultaneously presents its set of challenges. One way of going about dealing with these challenges is to present each data point, each “row” if you will, as a line across all axes parallel to each other. This project aim to provide a solution for any such dataset.
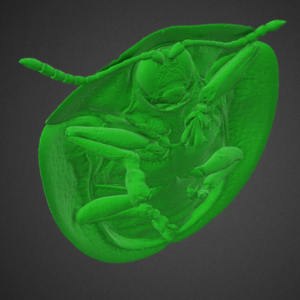
This project focused on developing a user-friendly and accessible pipeline for producing 3D models or ‘meshes’ from volumetric datasets, specifically for this case, in the domain of biology.
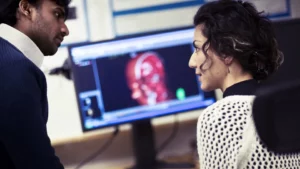
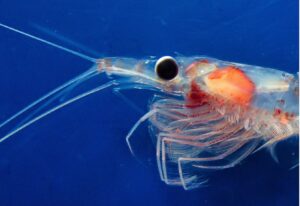
VR and formas applications are coming soon! InfraVis is a resource for your Grant applications It is grant application season for VR and FORMAS. Please, consider our InfraVis Resources towards your application. Contact us via the InfraVis User Support and we will assist with a description of InfraVis resources supporting your applications. Photo credits: Tina Stafrén, Mittuniversitetet