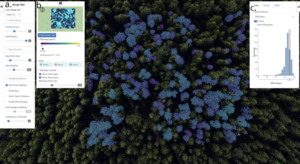
ForestVis: Visualizing Individual Tree Characteristics in Forest 3D Point Clouds Using Remote Sensing Data
ForestVis is a web-based 3D visualization system for the interactive visual exploration of forest data.
ForestVis is a web-based 3D visualization system for the interactive visual exploration of forest data.
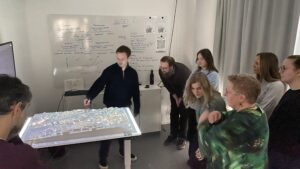
Urban planning is complex, and rising water levels due to climate change add further challenges.

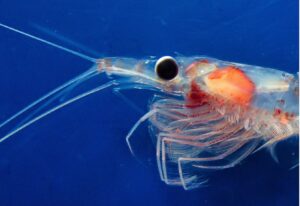
InfraVis contributed to the Ocean Science Meeting in Glasgow, where Helena Filipsson and colleagues presented work on artificial cod reefs, VR‑based marine outreach, and high‑resolution scans of foraminifera from museum samples. Their presentations highlighted how InfraVis supports marine research through advanced visualization, automated analysis, and immersive communication tools.
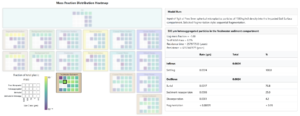
QuarryGIS is an interactive environmental visualization and benchmarking tool built to make quarry and construction sector impacts tangible for producers, clients, and planners.
The aim of the project is to produce the novel interactive tool “GenomeLens”, that uses genome sequencing data to visualize genetic variation along chromosomes within and between populations.
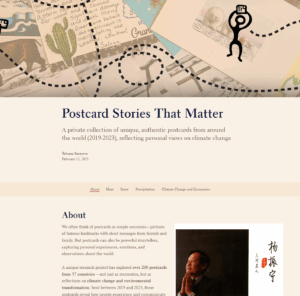
The project’s primary objective is to connect a collection of postcards about climate change with actual climate monitoring data and data about economic inequality.
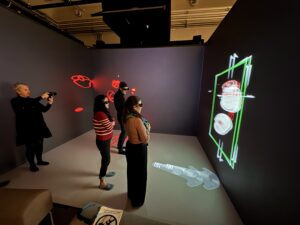
The InfraVis node at Lund University has developed an application and workflow to visualize tomographic datasets in the immersive CAVE system at the Virtual Reality laboratory at LTH – Faculty of Engineering. The workflow was originally made for the LINXS hackathon SynchroMage: 3D Tomography and Visualisation for Earth’s Hidden Treasures – Environment and Climate theme, but after a positive evaluation from participants, also described in the following LINXS article, we have kept the development going.
Plastic pollution has emerged as a significant environmental concern, drawing increasing attention from the public and government agencies. In recent years, the presence of microplastics in aquatic and terrestrial ecosystems worldwide has become a critical focus of concern.
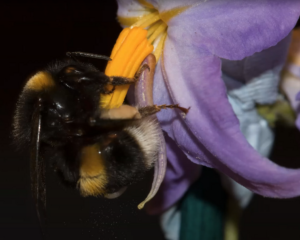
This project aims to showcase the current theory for the dynamics of pollen grains inside the anthers of certain flowers, when bumblebees interact with them. This phenomenon is called ‘Buzz Pollination’.
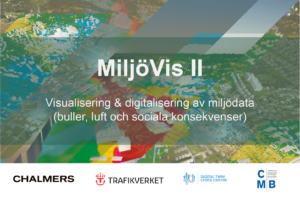
The project aims to develop and scale up new methods and solutions for 3D-visualization of invisible data (air, sound, and social consequences)