Julius Häger
Application Expert
competency

Application Expert

Node Coordinator

Application Expert

This project explores ways of visualizing data concerning the literacy metrics of elementary school children in Sweden, collected using a sophisticated tool developed for this very purpose.

Displaying many dimensions of a dataset simultaneously presents its set of challenges. One way of going about dealing with these challenges is to present each data point, each “row” if you will, as a line across all axes parallel to each other. This project aim to provide a solution for any such dataset.

Application Expert

Node Coordinator

Application Expert, Technical Manager, InfraVis Faculty

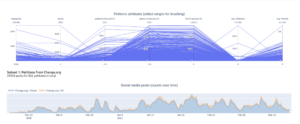
Researchers in political science make use of an information visualization dashboard to understand how the contents of social media posts addressing published e-petitions relate to the theoretical model of mobilisation strategies.

Application Expert, Website Designer and Administrator