InfraVis’s main activity towards the public is supporting researchers in the form of projects, specifically supporting them with visualization skills, experience, and knowledge. Depending on the scope of those projects, they may be classified as one out of two different classifications.
Projects
Mid-level Projects
This classification is given to projects that are evaluated to take no more than a set amount of time (currently set to ~80 hours of involvement from our end). In most cases for these kinds of projects, the path towards the end goal is clear enough for us, that the time needed is mostly spent on getting a working viable prototype according to specifications up and running. Any eventual questions that may spring up in projects such as these are usually in the realms of what the researcher prefers specifically or domain-specific knowledge.
This level of support is given free of charge.
In-Depth Projects
For projects that are much larger in scope, and it is not feasible to have it done within the set amount of time for a Mid-Level project, we give the In-Depth classification. The common denominator for these projects, other than taking a large amount of hours, is that it is not exactly clear how the desired output for the project will be achieved. It may take more than a few iterations and evaluations from the researcher(s) and possibly their own users. In the more extreme cases, it may involve inventing new methods for visualization entirely.
Due to the grand nature of these projects, this level of support involves contributing in the form of user fees or in-kind contributions.
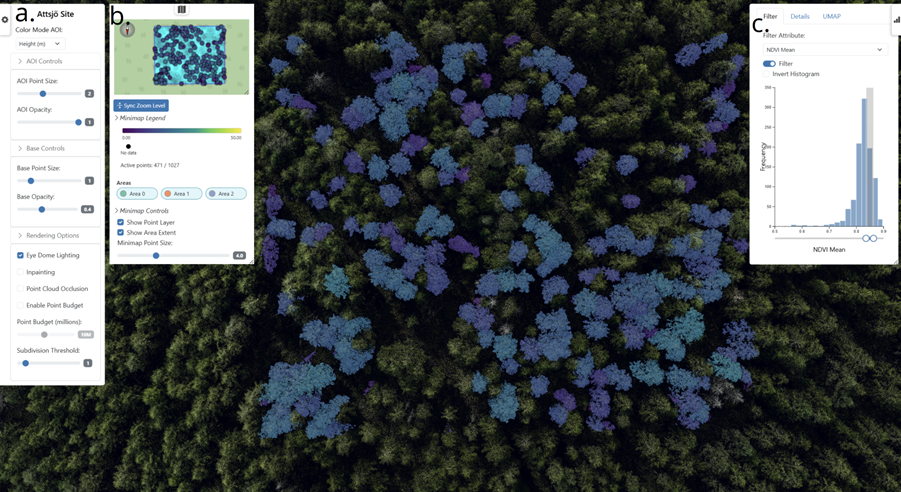
ForestVis: Visualizing Individual Tree Characteristics in Forest 3D Point Clouds Using Remote Sensing Data
ForestVis is a web-based 3D visualization system for the interactive visual exploration of forest data.Consent forms for people with limited previous education
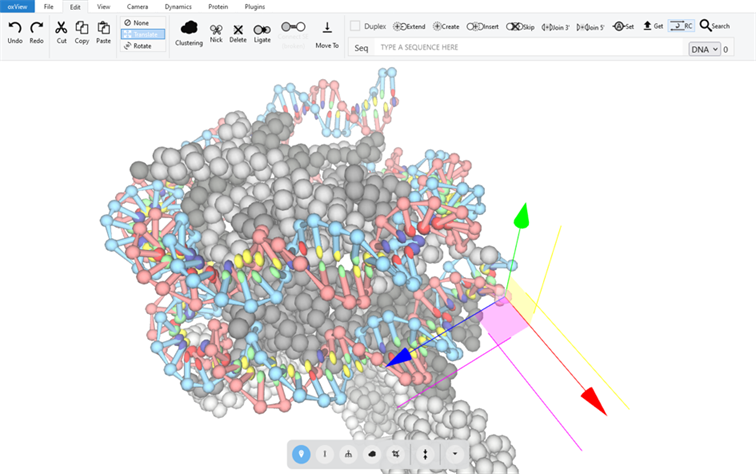
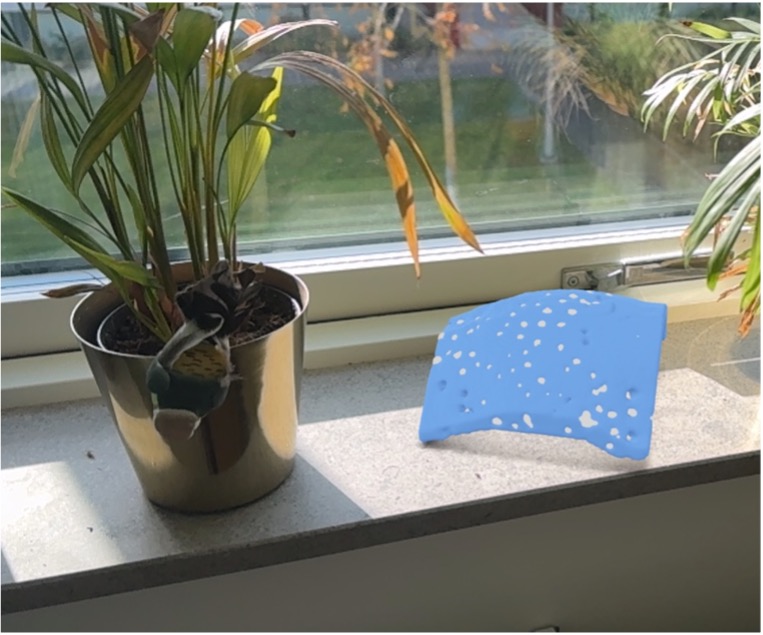
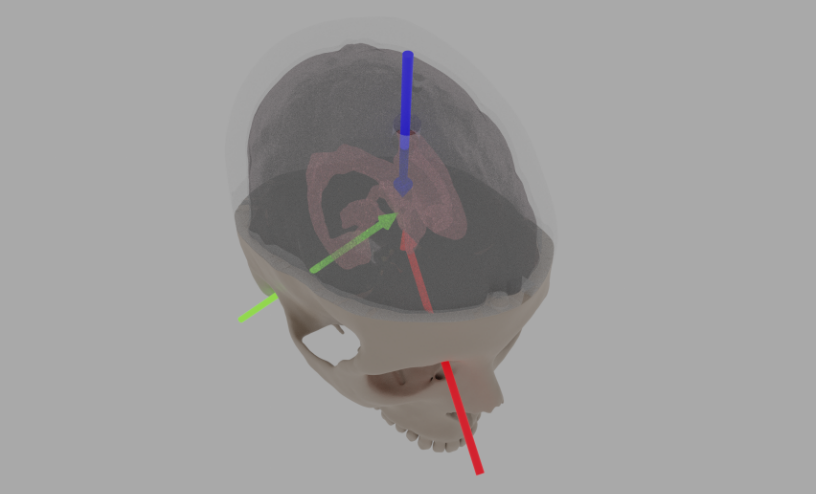
In this project, simple, multilingual videos were created to help refugees better understand and give informed consent to research participation.Visualizing physical interactions of molecules in macromolecular scale
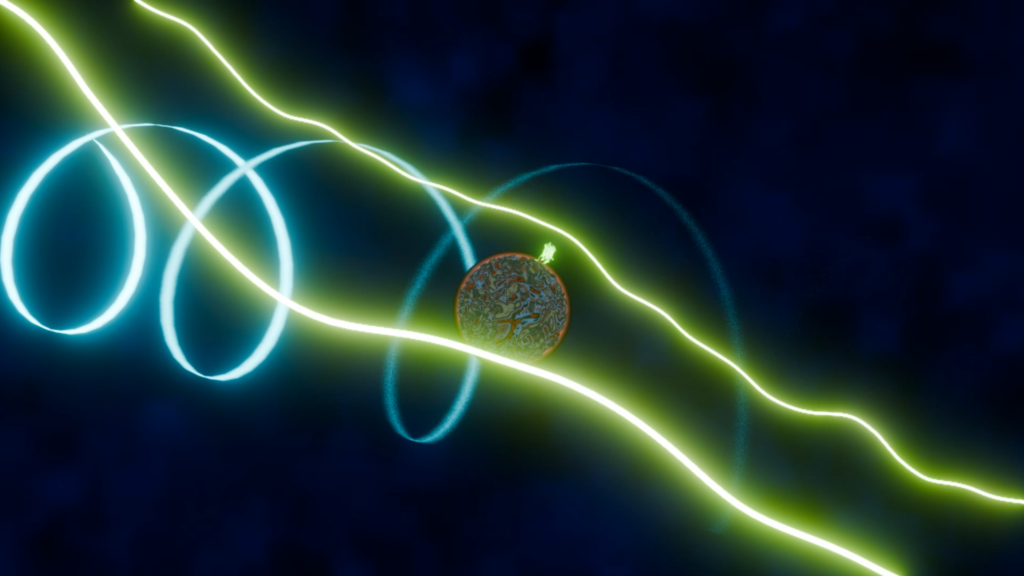
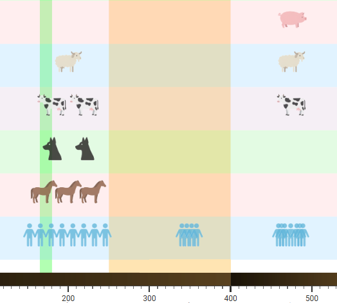
The research group led by Ilaria Testa (KTH, SciLife Lab) has developed a novel method for measuring the rotation of molecules in a solution.

development Projects
Curated selection of projects that InfraVis has engaged in towards developing a competency of its application experts as well as its collaboration mechanisms with other infrastructure projects.
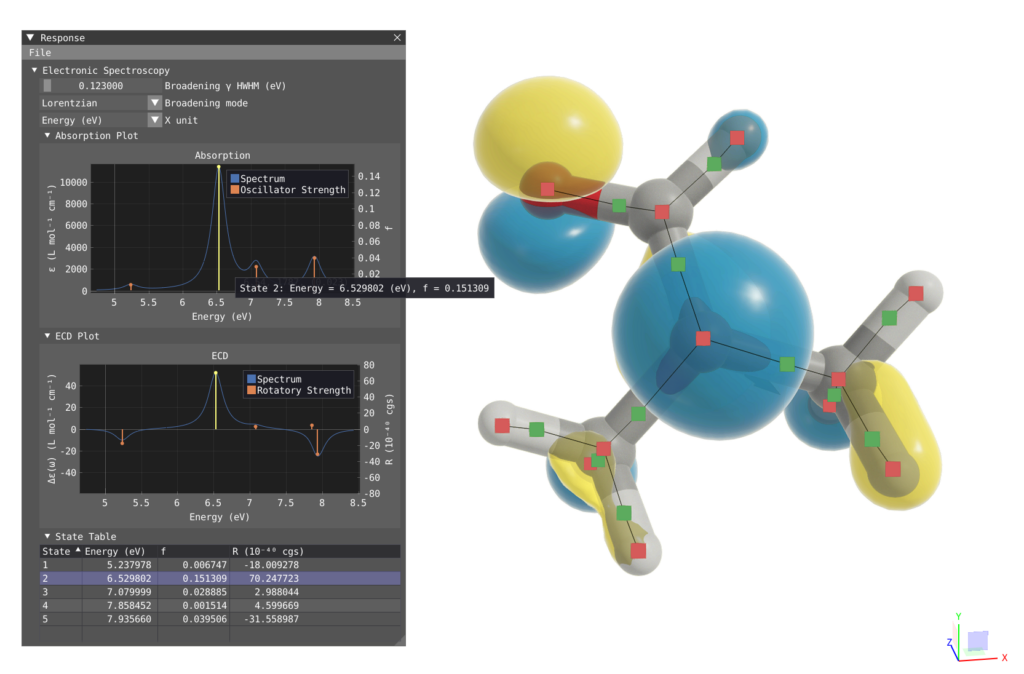
VIAMD (Visual Interactive Analysis of Molecular Dynamics)
VIAMD (Visual Interactive Analysis of Molecular Dynamics) is an innovative open-source software designed to enhance and streamline the analysis of molecular dynamics (MD) simulations.The Postcard Project
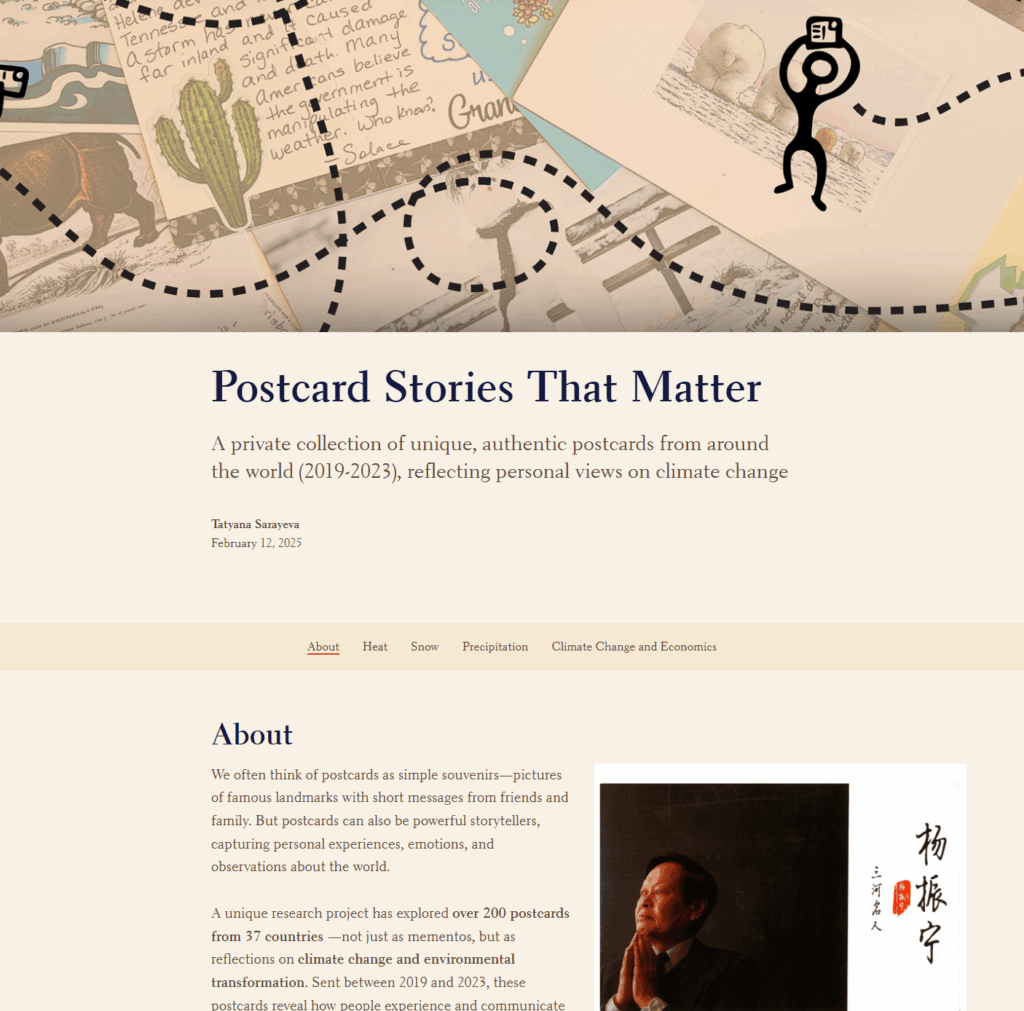
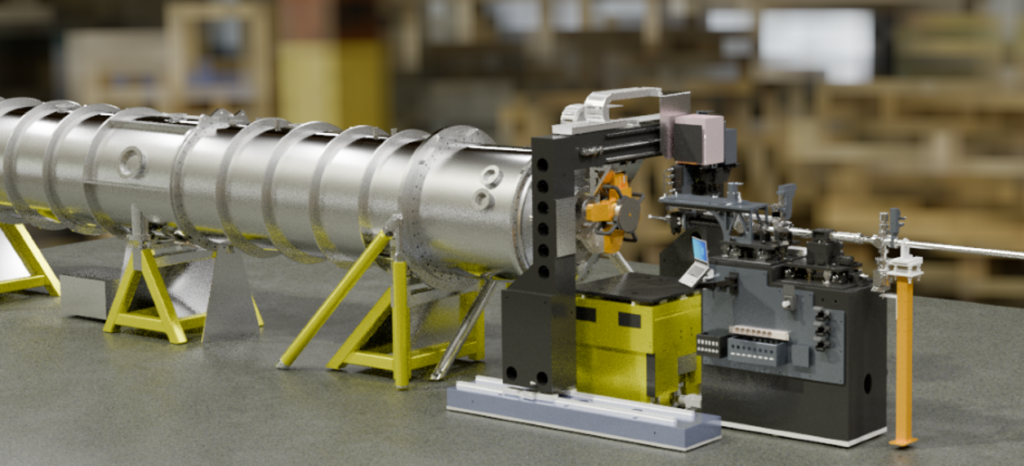
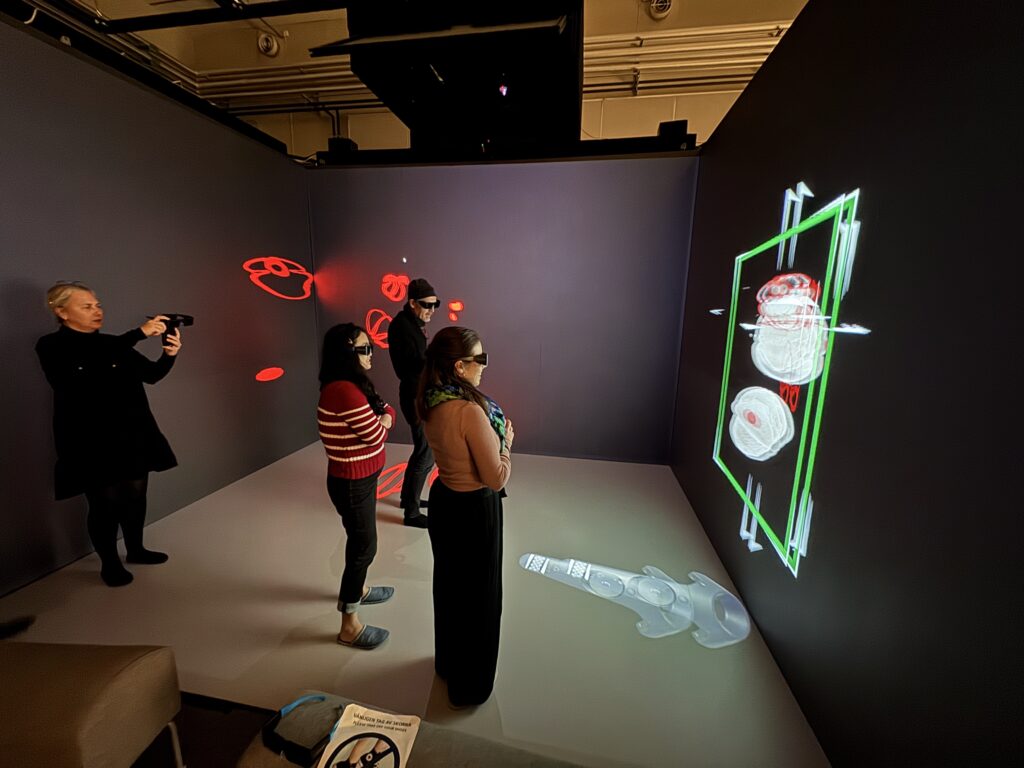
The project’s primary objective is to connect a collection of postcards about climate change with actual climate monitoring data and data about economic inequality.Constructing a virtual Synchrotron X-ray beamline
Researchers from InfraVis and MAX IV are developing virtual environments from CAD drawings for education, training, and virtual experiments. Using Blender and Unreal Engine 5,…