
Our Impact: Environment
Tools that transform climate and environmental data into evidence‑based insight. This supports policy, strategic decisions, and sustainability planning.
-
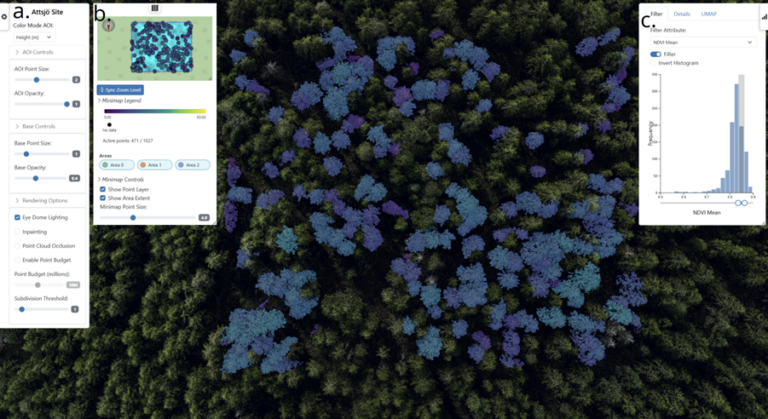
ForestVis: Visualizing Individual Tree Characteristics in Forest 3D Point Clouds Using Remote Sensing Data
ForestVis is a web-based 3D visualization system for the interactive visual exploration of forest data.
-
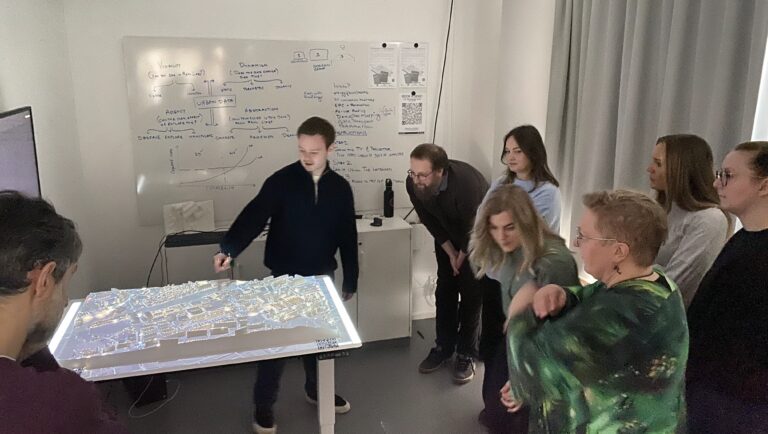
Digital Twin Cities – visualizing the future
Urban planning is complex, and rising water levels due to climate change add further challenges.
-
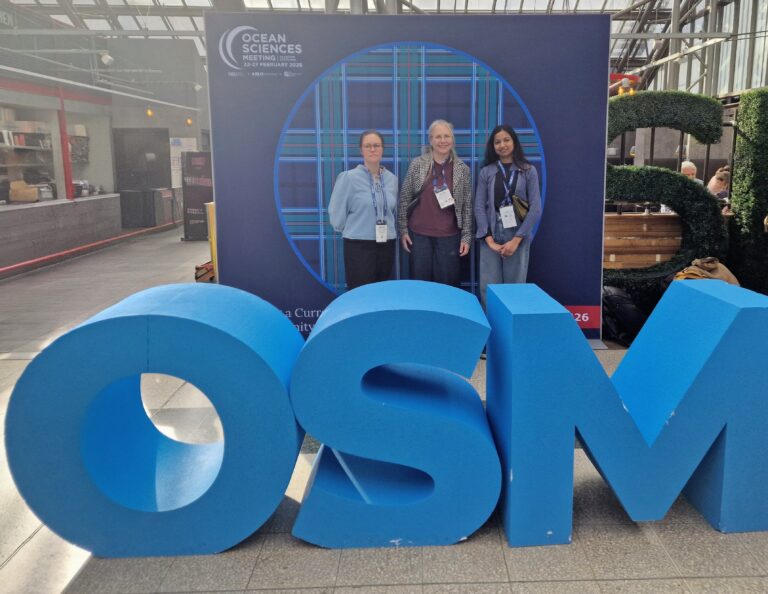
InfraVis at the Ocean Sciences Meeting in Glasgow
InfraVis contributed to the Ocean Science Meeting in Glasgow, where Helena Filipsson and colleagues presented work on artificial cod reefs, VR‑based marine outreach, and…
-
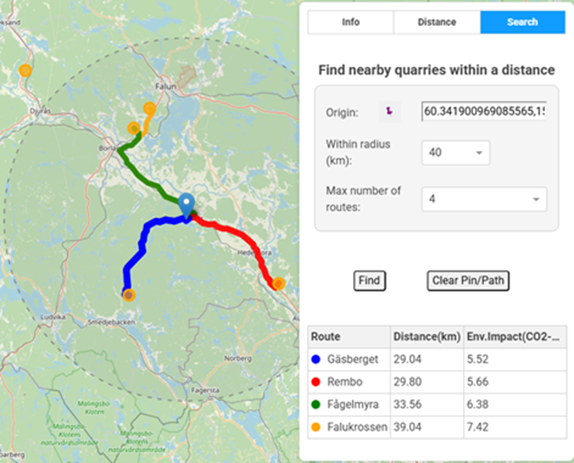
GIS Benchmark Tool for Environmental Impact of Quarries and Mining Industry
QuarryGIS is an interactive environmental visualization and benchmarking tool built to make quarry and construction sector impacts tangible for producers, clients, and planners.
-
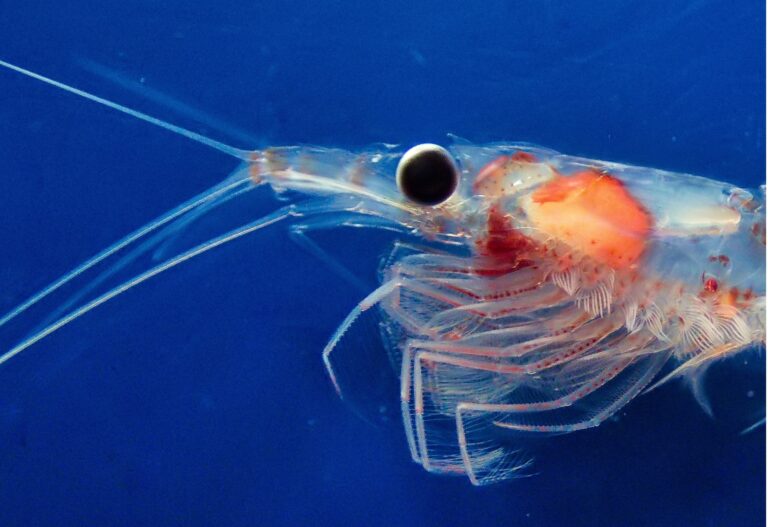
GenomeLens
The aim of the project is to produce the novel interactive tool “GenomeLens”, that uses genome sequencing data to visualize genetic variation along chromosomes…
-
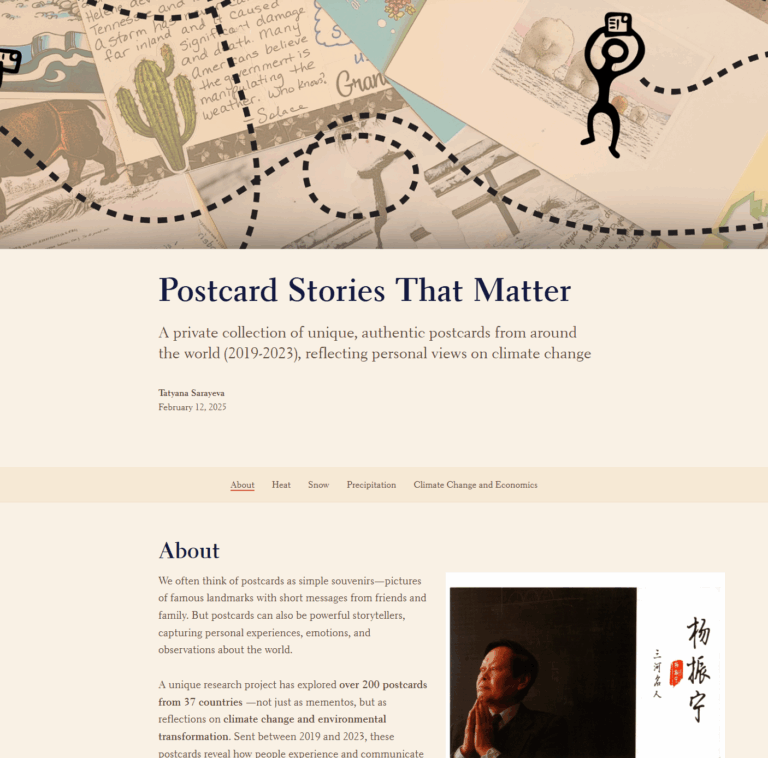
The Postcard Project
The project’s primary objective is to connect a collection of postcards about climate change with actual climate monitoring data and data about economic inequality.
-
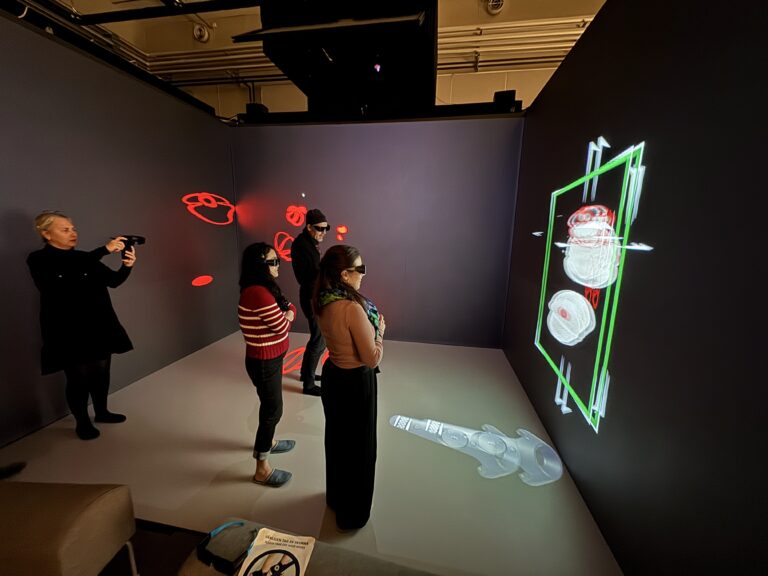
Volume and slice visualization in the CAVE at LTH’s VR lab
The InfraVis node at Lund University has developed an application and workflow to visualize tomographic datasets in the immersive CAVE system at the Virtual…
-
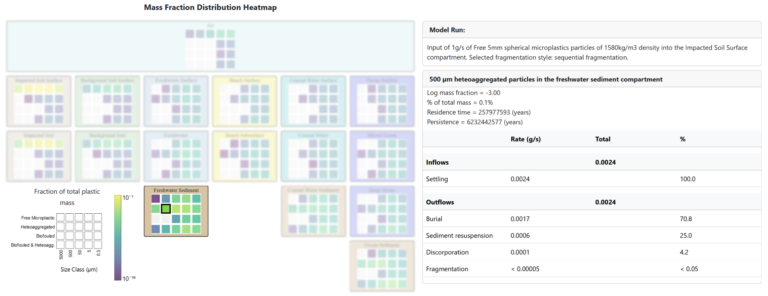
Utopia web app: Study Microplastics Fate And Transport On A Global Scale
Plastic pollution has emerged as a significant environmental concern, drawing increasing attention from the public and government agencies. In recent years, the presence of…
-
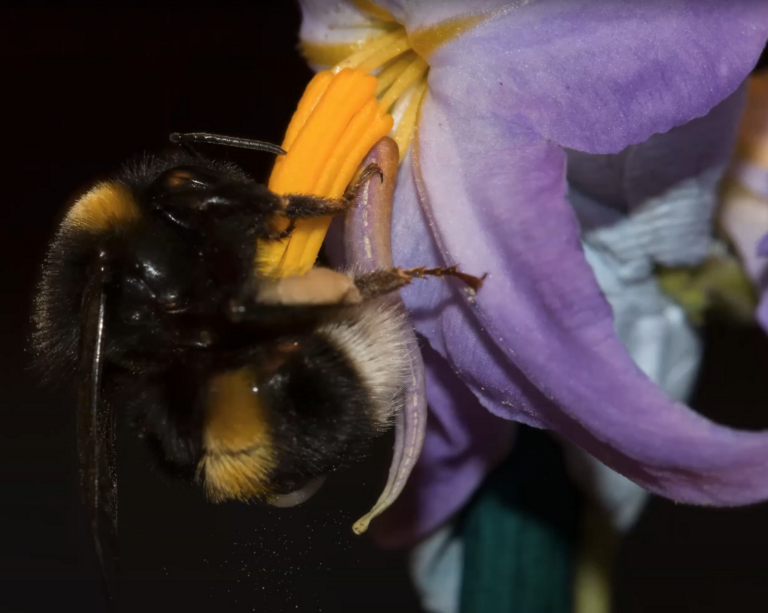
Visualizing Buzz Pollination
This project aims to showcase the current theory for the dynamics of pollen grains inside the anthers of certain flowers, when bumblebees interact with…
-
MiljöVis II & MålVis 2022 – 2024
The project aims to develop and scale up new methods and solutions for 3D-visualization of invisible data (air, sound, and social consequences)
-
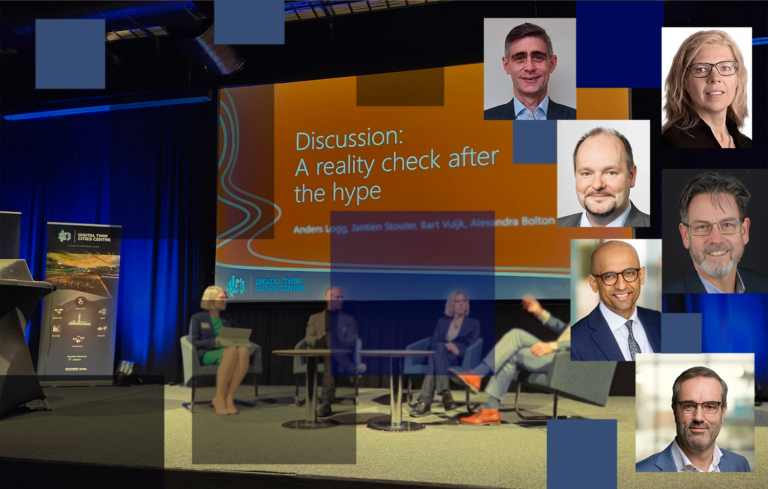
Bridging the gap between vision and reality in Digital Twins for Cities
Digital Twins – where are we at?
-
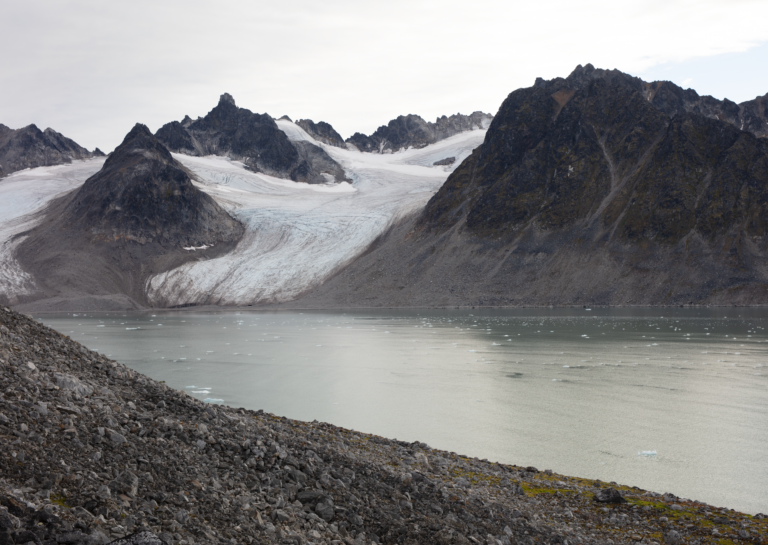
Extended Rephotography
We develop interactive spatio-temporal views of arctic areas affected by climate change, where the researchers can register their data and compare the material to trace the changes of the landscape over…