
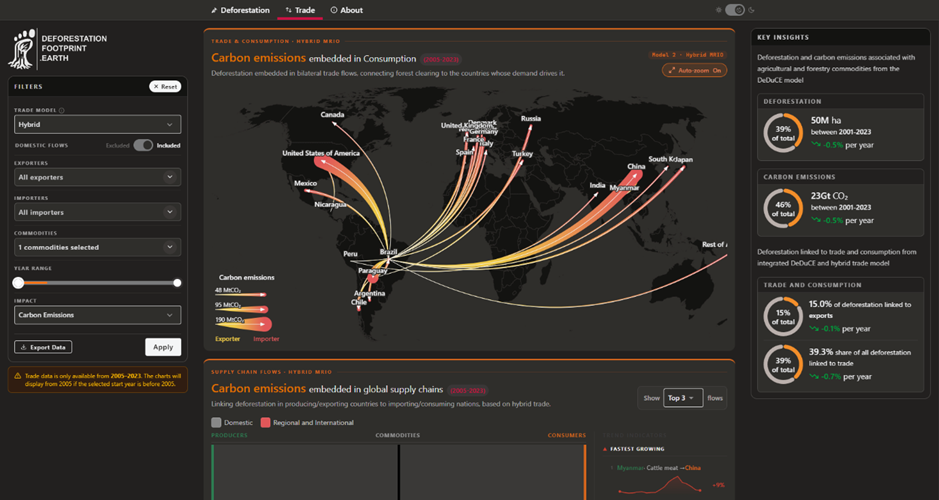
Screenshot by Måns Gezelius
Forest to fork: Building a platform for tracking deforestation and carbon emissions embodied in the trade of agricultural commodities
InfraVis User
Martin Persson (Chalmers), Chandrakant Singh (Chalmers)
InfraVis Application Expert
Måns Gezelius (Project Manager, LiU), Ylva Selling (Developer, LiU), Yin He (Designer, LiU)
InfraVis Node Coordinator
Lonni Besançon (LiU)
Funding
InfraVis
Background
Understanding the drivers of global deforestation requires tracing complex links between local land clearing and international demand. The Deforestation Driver & Carbon Emissions (DeDuCE) model quantifies commodity-driven deforestation and associated carbon emissions across more than 180 commodities and 180 countries for the period 2001–2023.
To connect production-side clearing with consumer demand, DeDuCE outputs are integrated with two trade models:
- Physical Trade Model: Tracks direct agricultural commodity flows using FAOSTAT bilateral trade data.
- Hybrid MRIO Model: Combines physical trade with multi-regional input-output monetary flows to capture embodied deforestation through to final consumption.
The primary objective of this project was to synthesize these high-dimensional, complex datasets into an interactive, publicly accessible web platform for researchers, journalists, policymakers, and industry stakeholders.
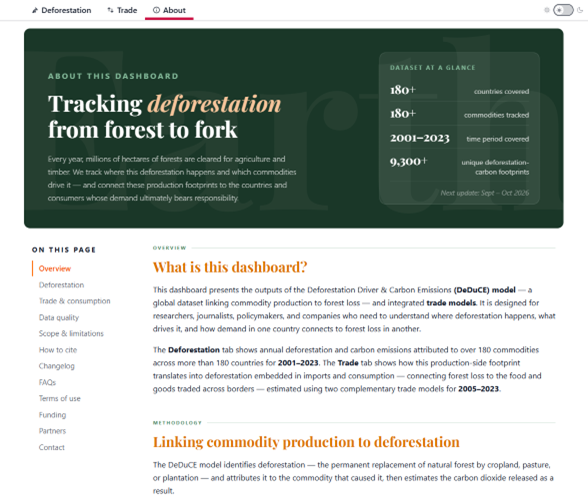
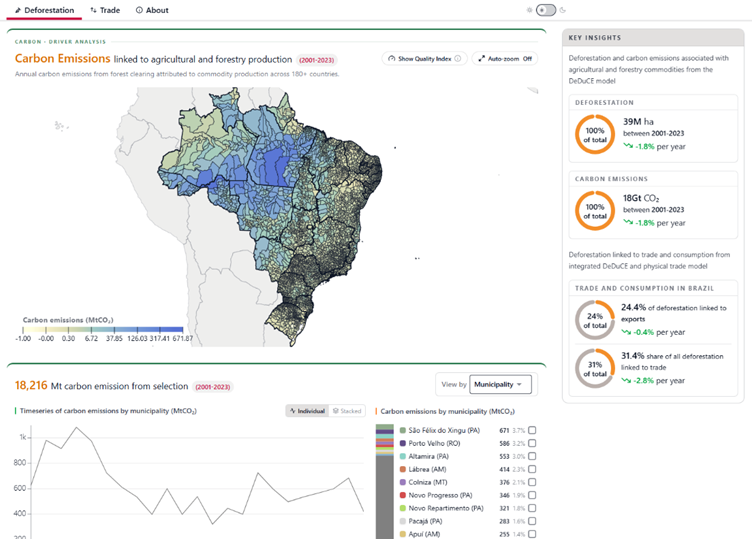
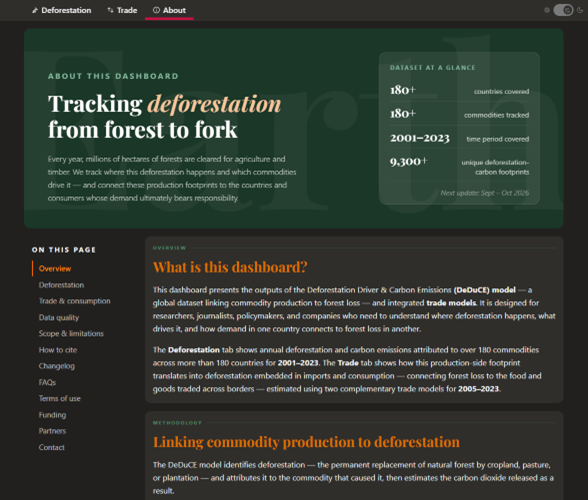
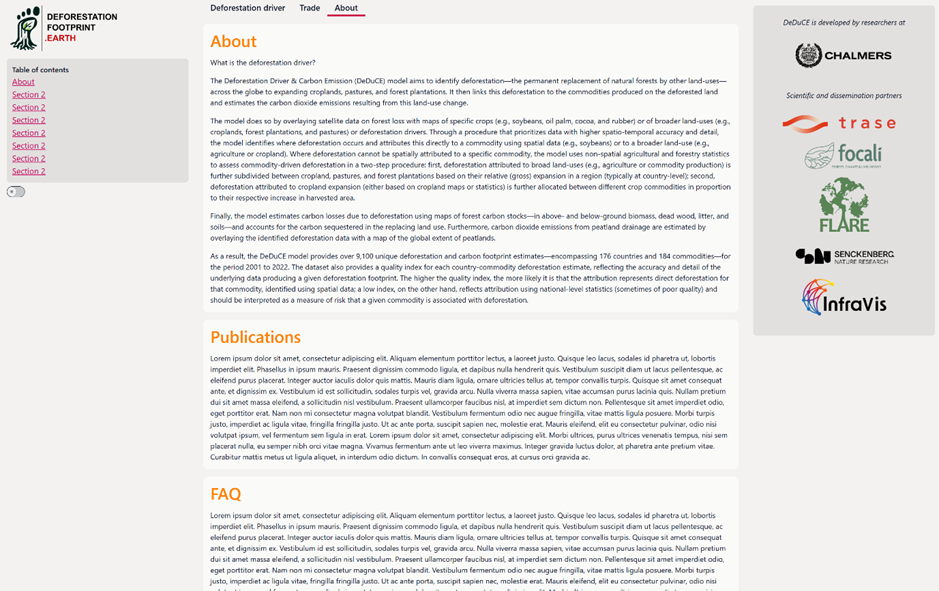
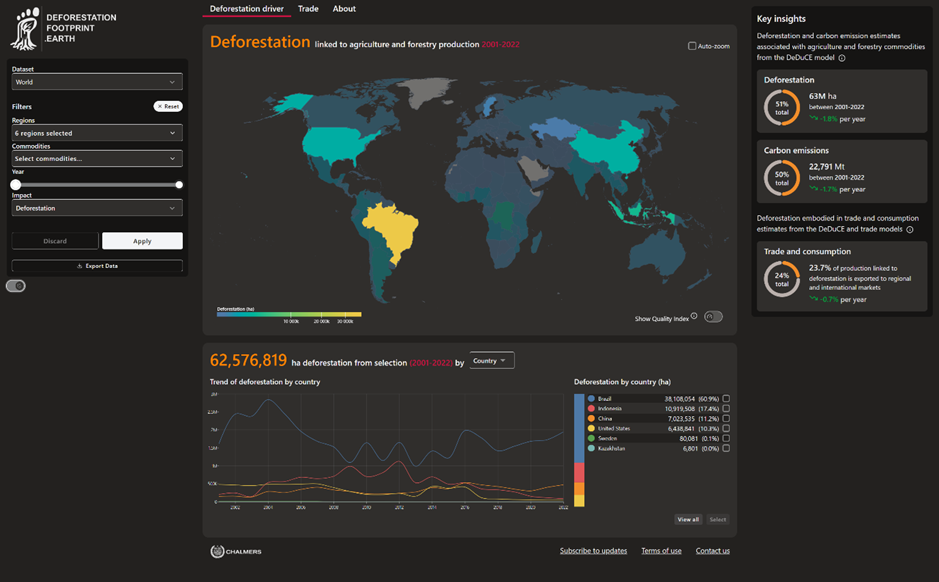
Detailed description
The frontend interface was built using Svelte combined with Mapbox for interactive geospatial rendering. Data visualizations and custom charting were implemented using D3 and LayerChart to communicate multi-layered environmental trends.
To handle the extensive backend workload, Google BigQuery was integrated as the core database solution. This enabled real-time data requests, dynamic filtering, and complex aggregation queries across massive, multi-country commodity trade matrices.
Challenges/Opportunities
Managing dynamic filtering across hundreds of commodities, temporal ranges from 2001 to 2023, and global country-level trade pairings presented a database optimization challenge. Designing efficient BigQuery queries was essential to keep user interaction responsive across large datasets.
A key methodological challenge was effectively conveying complex statistical nuances to a broad audience. The platform needed to visually distinguish between direct land-use change (“IQI”>0.6) and statistical land-use change (“IQI”≤0.6), as well as separate physical versus hybrid trade models, ensuring users did not misinterpret or incorrectly combine complementary data layers.
Creating an accessible user interface required balancing depth and clarity. The application was designed so that both domain researchers and non-technical stakeholders, such as policy analysts and journalists, could intuitively navigate from high-level national consumption footprints down to granular supply-chain risk exposures.
Results
The project delivered a web dashboard that enables global users to explore how commodity production directly and indirectly drives land conversion and carbon emissions worldwide.
The platform provides the clients with a dissemination tool, boosting the reach and visibility of their scientific findings while providing a central hub for researchers, policymakers, and industry actors to engage with the data.
Following the completion of the project, full access and control of the source code repository were handed over to the client team. This handover empowers the client to independently maintain, update, and host the website alongside future iterations of their underlying research.
The website can be accessed here: https://deforestationfootprint.earth/about