ForestVis: Visualizing Individual Tree Characteristics in Forest 3D Point Clouds Using Remote Sensing Data
ForestVis is a web-based 3D visualization system for the interactive visual exploration of forest data.
node
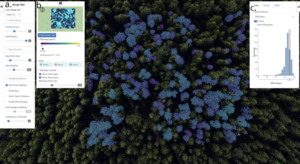
ForestVis is a web-based 3D visualization system for the interactive visual exploration of forest data.
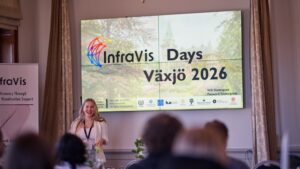
InfraVis Days, 21-23 April 2026, at Linnaeus University showed the strength of InfraVis as a shared national research infrastructure, where eight nodes work together as one. User examples made clear how visualization enables new knowledge that would otherwise be impossible. Warm thanks to our hosts Karen Larkina, Andreas Kerren, and the entire Linnaeus University node for three generous and rewarding days.

Application Expert

Application Expert
The aim of the project is to produce the novel interactive tool “GenomeLens”, that uses genome sequencing data to visualize genetic variation along chromosomes within and between populations.

Application Expert
Plastic pollution has emerged as a significant environmental concern, drawing increasing attention from the public and government agencies. In recent years, the presence of microplastics in aquatic and terrestrial ecosystems worldwide has become a critical focus of concern.

Application Expert

Application Expert

Node Coordinator