Kristin Åkerlund
Application Expert
competency

Application Expert

This project explores ways of visualizing data concerning the literacy metrics of elementary school children in Sweden, collected using a sophisticated tool developed for this very purpose.
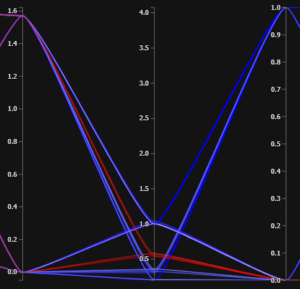
Displaying many dimensions of a dataset simultaneously presents its set of challenges. One way of going about dealing with these challenges is to present each data point, each “row” if you will, as a line across all axes parallel to each other. This project aim to provide a solution for any such dataset.

Application Expert