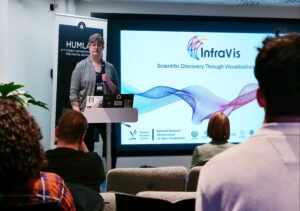
InfraVis at satellite event to Swedish e-Science Academy 2025
InfraVis hosted a satellite event that was held during the InfraVis at satellite event to Swedish e-Science Academy 2025 together with Humlab and the Environmental Archaeology Lab (MAL).
InfraVis hosted a satellite event that was held during the InfraVis at satellite event to Swedish e-Science Academy 2025 together with Humlab and the Environmental Archaeology Lab (MAL).
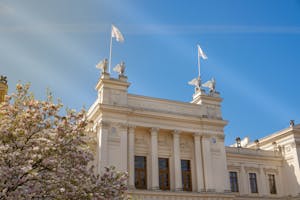
Welcome to Lund University Open Science Day. InfraVis is part of the session Innovation and Open Science. Registration deadline November 6th.

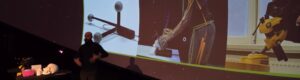
At the Treesearch workshop at MAX IV Laboratory, InfraVis experts held a presentation, plus a Virtual Reality demo of the ForMAX beamline, where visitors could virtually visit the beamline.
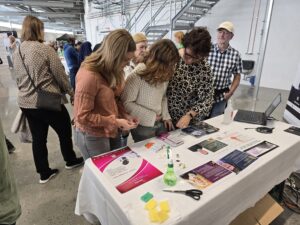
InfraVis teamed up with LINXS Institute of advanced Neutron and X-ray Science to welcome visitors at the Open Day at MAX IV Laboratory in Lund.
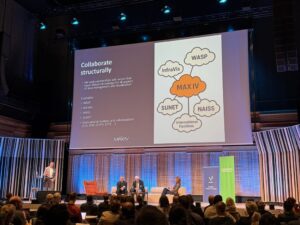
InfraVis joined the summit to highlight how Swedish national research infrastructures work for better handling, analysis and visualization of data.
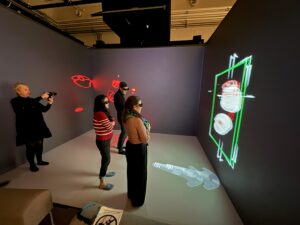
ForskarFredag is a one-week annual science festival held at various places around Sweden and InfraVis contributed with activities in Lund and Norrköping.
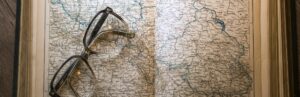
Welcome to a hands-on GIS workshop at Uppsala University 6 November 13.15-15. The workshop is held by InfraVis application expert Vasiliki Tsoumari.
We are proud to announce that InfraVis has been granted another round of funding from the Swedish Research Council!
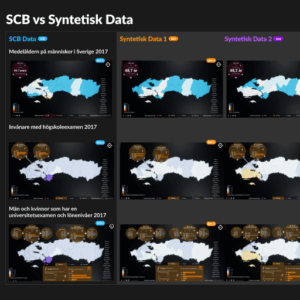
The goal of this project was to introduce synthetic demographic data to a public audience through an extension of the existing “Sweden-in-Numbers” installation.

A big thank you to our wonderful hosts at the Gothenburg node who made the bi-annual internal event InfraVis Days very fruitful and pleasant. Workshops, presentations, immersive dome experiences, new angles on knowledge, and of course, a chance for all of us to meet in person.