Digital Twin Cities – visualizing the future

Urban planning is complex, and rising water levels due to climate change add further challenges.

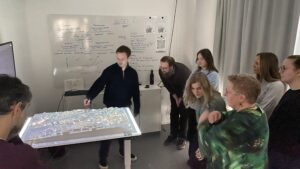
Urban planning is complex, and rising water levels due to climate change add further challenges.
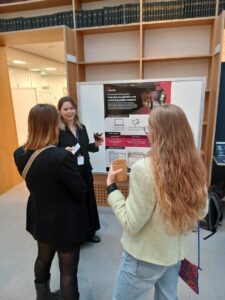
How do digital humanities researchers work with large and complex datasets?
At the DHNB: Digital Humanities in the Nordic and Baltic Countries 2026 conference in March, InfraVis was presented by Linnéa Tjernström and Evelina Liliequist (both from the Umeå University node at Humlab) at Aarhus University through a poster and lightning talk.
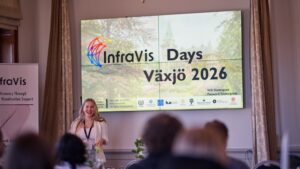
InfraVis Days, 21-23 April 2026, at Linnaeus University showed the strength of InfraVis as a shared national research infrastructure, where eight nodes work together as one. User examples made clear how visualization enables new knowledge that would otherwise be impossible. Warm thanks to our hosts Karen Larkina, Andreas Kerren, and the entire Linnaeus University node for three generous and rewarding days.
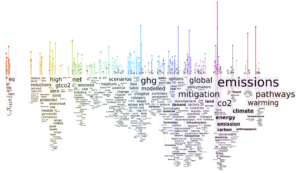
Welcome to this free and open hybrid workshop that aims at bringing together developers and researchers, primarily from the humanities, with an interest in using text visualization for exploring texts.
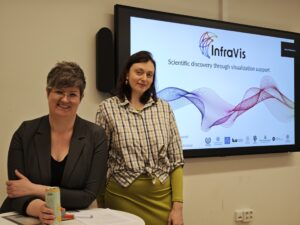
SciLifeLab Umeå and KBC hosted a lunch seminar at Umeå University focusing on InfraVis and its opportunities for researchers.
How do digital humanities researchers work with large and complex datasets?
At the DHNB: Digital Humanities in the Nordic and Baltic Countries 2026 conference in March, InfraVis was presented by Linnéa Tjernström and Evelina Liliequist (both from the Umeå University node at Humlab) at Aarhus University through a poster and lightning talk.
Welcome to this half day workshop 21 April that will cover the Python tools you need to visualize your research. Register here.
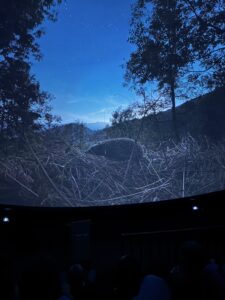
InfraVis recently joined the industry premiere of the dome film Darkness Matters by Costanza Julia Bani at m:brane in Malmö. InfraVis contributed to the production through Julius Häger, who provided precise measurements of light pollution at several specific locations.
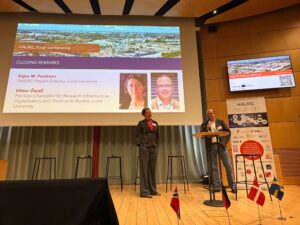
Cross‑border data collaboration is essential for unlocking the full value of major research infrastructures. The final HALRIC conference highlighted how coordinated expertise from QIM and CIPA/InfraVis boosts scientific impact and why long‑term, interoperable data support must be a shared priority.
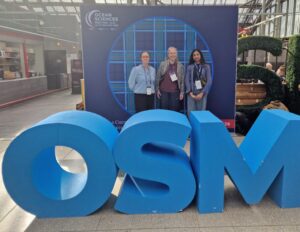
InfraVis contributed to the Ocean Science Meeting in Glasgow, where Helena Filipsson and colleagues presented work on artificial cod reefs, VR‑based marine outreach, and high‑resolution scans of foraminifera from museum samples. Their presentations highlighted how InfraVis supports marine research through advanced visualization, automated analysis, and immersive communication tools.