Workshop 21 April: Visualize your research using Python
Welcome to this half day workshop 21 April that will cover the Python tools you need to visualize your research. Register here.
Welcome to this half day workshop 21 April that will cover the Python tools you need to visualize your research. Register here.
Working together to transform research data into understanding, with InfraVis as a national hub connecting researchers, research infrastructures, and expertise to deliver scientific impact.
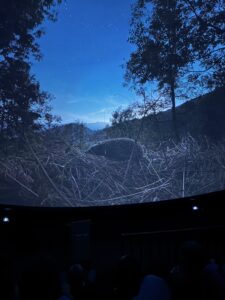
InfraVis recently joined the industry premiere of the dome film Darkness Matters by Costanza Julia Bani at m:brane in Malmö. InfraVis contributed to the production through Julius Häger, who provided precise measurements of light pollution at several specific locations.
Read the latest InfraVis newsletter, fresh from the press.
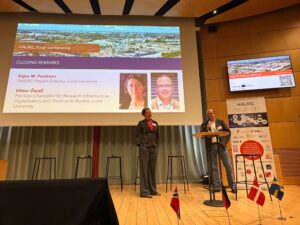
Cross‑border data collaboration is essential for unlocking the full value of major research infrastructures. The final HALRIC conference highlighted how coordinated expertise from QIM and CIPA/InfraVis boosts scientific impact and why long‑term, interoperable data support must be a shared priority.
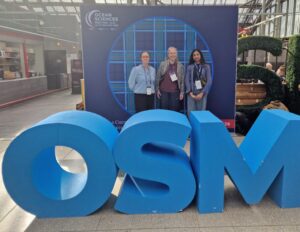
InfraVis contributed to the Ocean Science Meeting in Glasgow, where Helena Filipsson and colleagues presented work on artificial cod reefs, VR‑based marine outreach, and high‑resolution scans of foraminifera from museum samples. Their presentations highlighted how InfraVis supports marine research through advanced visualization, automated analysis, and immersive communication tools.
Welcome to this half day workshop 11 March that will cover the Python tools you need to visualize your research. Register here.
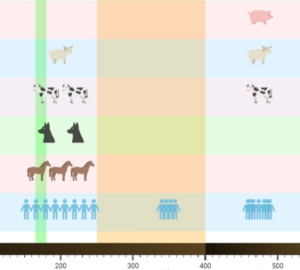
Human-Timeline is an interactive React and PlotlyJS application that visualizes the coevolution of human culture , diverse life species and environmental factors across vast timescales. Inspired by SIMILE’s TimePlot and TimeLine patterns, it combines stacked timelines with dual-axis plots so users can see discrete events, continuous measurements, and contextual periods in one place.
Welcome to this workshop in NodeGoat offered by InfraVis and CDHU 19 March 2026. NodeGoat is a web-based instrument designed for visualizing data from the social sciences and humanities across space and time. It enables users to map, connect, and analyze data, as well as to share research results in an interactive way.

Planning to apply for support for a research project? You can now easily express your interest for InfraVis in your grant application by simply selecting us from the dropdown menu for national infrastructures in the Swedish Research Council (Vetenskapsrådet) application form.