
Vanilla JS
Contact Person
Andreas Kerren
About
At the moment, in JS, the projects where not complex enough so we used just pure JS.
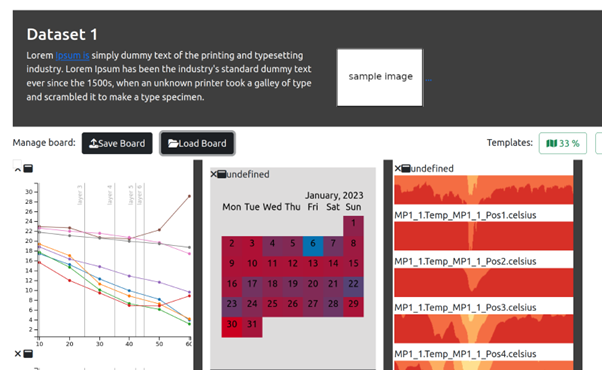
An example of this is Flexiboard, a customizable dashboard for time series data, offering 3 diagrams options: line graph, combined with parallel coordinates shape, then Heatmaps diagrams adapted to calendar views, and finally Horizon graphs.
Financial Support
Links
Get the Code of flexiboard: https://leonard.lnu.se/git/jaume/infravis-trahust