Picture provided by user
ForestVis: Visualizing Individual Tree Characteristics in Forest 3D Point Clouds Using Remote Sensing Data
InfraVis User
Johan E. S. Fransson (LnU), Jorge Zapico (LnU)
InfraVis Application Expert
Benjamin Powley, Petra Horváth, Claudio D. G. Linhares, Reem Othman, Karen Larkina, Amilcar Soares (all from LnU)
InfraVis Node Coordinator
Andreas Kerren (LnU)
Tools & Skills
Adobe Audition,Illustrator, After Effects & Premiere
Open Data
no
Background
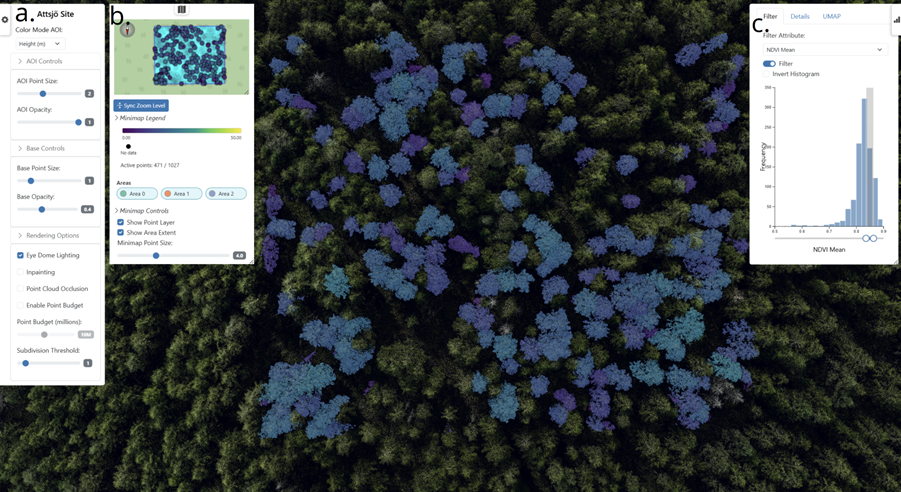
ForestVis is a web-based 3D visualization system for the interactive visual exploration of forest data. Tile-based streaming of large-scale point clouds combined with multiple interconnected visualizations enables the analysis of physiological and structural forest attributes over multiple spatial scales, from individual trees to forest stands, and larger forest areas. Point clouds contain data from LiDAR with RGB and vegetation indices derived from multispectral imagery.
A forest analyst using ForestVis can visualize point cloud data with a variety of different styles by configuring the rendering options. Configuring small point sizes shows precise structural information about the trees. Rendering styles such as point cloud occlusion, inpainting and eye dome lighting can configure the point cloud visualization with a surface-like appearance for analysing patterns in point cloud data over larger areas.
Interactive filtering allows analysts to compare selections of forest attributes. For example, a forest analyst can analyse attributes for tall trees, or short trees by selecting a height range on an interactive histogram filter. Clustering is analysed with a dimensionality reduction diagram for different combinations of attributes. Box selections on the dimensionality reduction diagram can filter the point cloud to inspect point cloud attributes within localized neighbourhoods in relation to the point cloud structure. The forest can be navigated by interacting with the 3D view or the mini-map. Density curves for NDVI and RGB data can be interactively generated and viewed by selecting individual trees from the interconnected mini-map showing the forest area of interest.
ForestVis can be applied to sustainable forest management, precision forestry, biodiversity monitoring, and ecological research. ForestVis supports identification of tree stress and segmentation errors through interactive filtering.
Picture provided by the user.