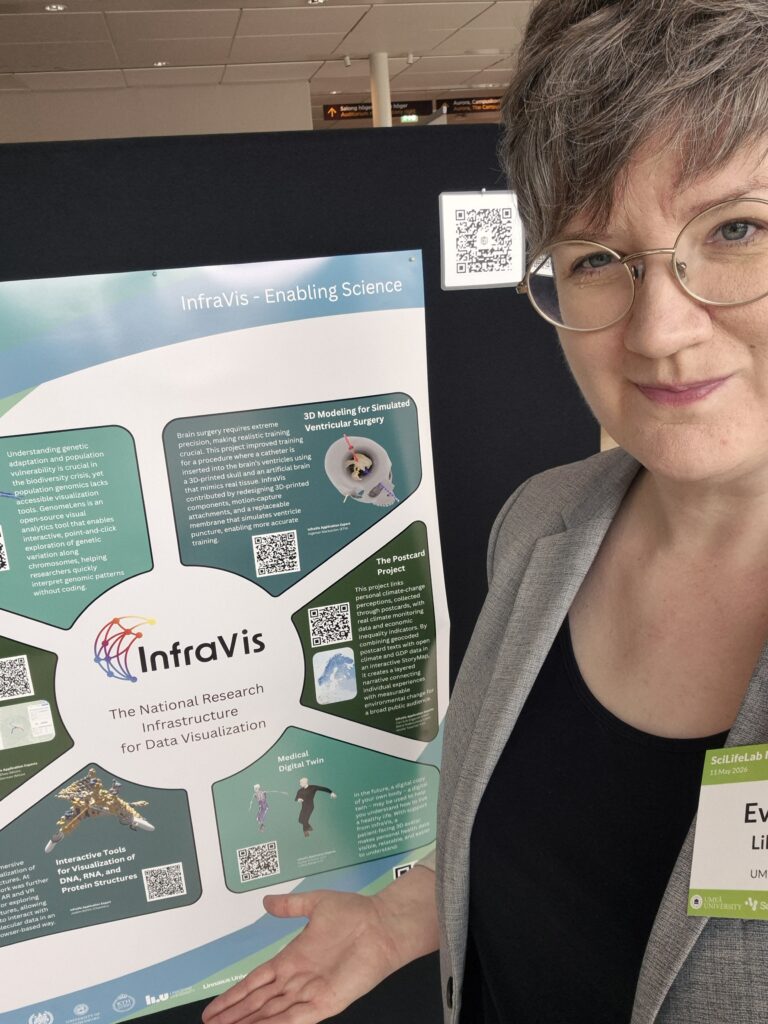
The National Research Infrastructure for Data Visualization
InfraVis helps you visualize research data from any scientific domain and gives you access to state-of-the-art visualization competence, support, equipment, training, and methods.


Highlights
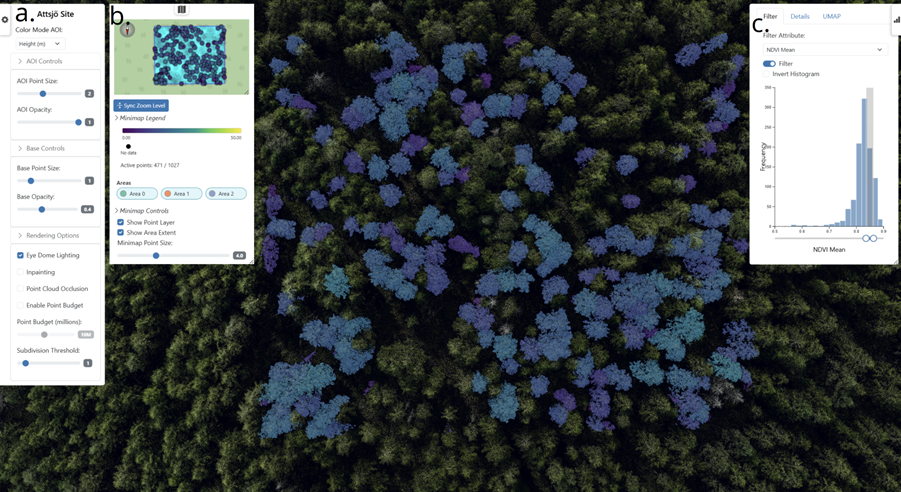
ForestVis: Visualizing Individual Tree Characteristics in Forest 3D Point Clouds Using Remote Sensing Data
ForestVis is a web-based 3D visualization system for the interactive visual exploration of forest data.Consent forms for people with limited previous education
In this project, simple, multilingual videos were created to help refugees better understand and give informed consent to research participation.Visualizing physical interactions of molecules in macromolecular scale
The research group led by Ilaria Testa (KTH, SciLife Lab) has developed a novel method for measuring the rotation of molecules in a solution.


Step 1
Submit your question to InfraVis
Reach out to InfraVis by clicking “Receive support from InfraVis”
Do you come from an academic institution and want to discuss visualization opportunities in your data?
Do you have a question about InfraVis services?
Step 2
A ticket is generated and handled
Handling Hours:
Monday-Friday, 09:00 – 16:00
You can expect the first response within three hours after submitting your question.
For example, a ticket generated at 15:00 on Friday warrants a response no later than 11:00 on Monday, unless these days happen to be holidays.
Please expect a delay in response during July and around Christmas and New Year.
Step 3
You receive InfraVis user support
Depending on the nature of your inquiry, you receive three different levels of user support
Help-desk support
Free of charge
Mid-level support
Free of charge
In-depth support
Application process & user fee applies
Three different levels of user support
Help-desk Support
- Internal evaluation of your submitted question
- Guidance to the right InfraVis resources: An InfraVis Expert contacts you and provides you with advice
Mid-level support
For projects that typically require up to 80 hours of support
You meet with an InfraVis Expert to discuss visualization needs and possibilities in your data, as well as to determine the scope of the needed resources
Mid-level support may include, for example:
- InfraVis Experts working on the visualization of your data
- Your participation in data clinics where InfraVis Experts carefully examine your project and discuss solutions
- InfraVis Experts helping you with writing the visualization part of your application for funding
In-depth support
For projects that typically require more than 80 hours of support
InfraVis offers two ways to apply for in‑depth support.
The primary is the annual open call: 2025.
The alternative is an application submitted at any other time of the year.
For proposals coming in during the open call, InfraVis has allocated resources for reviewing and supporting in‑depth projects that makes the cost of the support currently 275 SEK/hour. For projects accepted outside the open call the cost is 600 SEK/hour.
At this level, support may entail tailoring existing software solutions or even implementing new approaches and methods specific to the application at hand
The processes regarding the project are iteratively co-defined and run by you and InfraVis Experts, with respect to your specific needs
The project specification is then considered by the InfraVis Steering Committee, which prioritizes and allocates InfraVis resources