Our Impact: Outreach & Events
Making research accessible through visual stories, training, workshops, and public events. This expands access to science, deepens understanding, and strengthens the role of research in society.
-
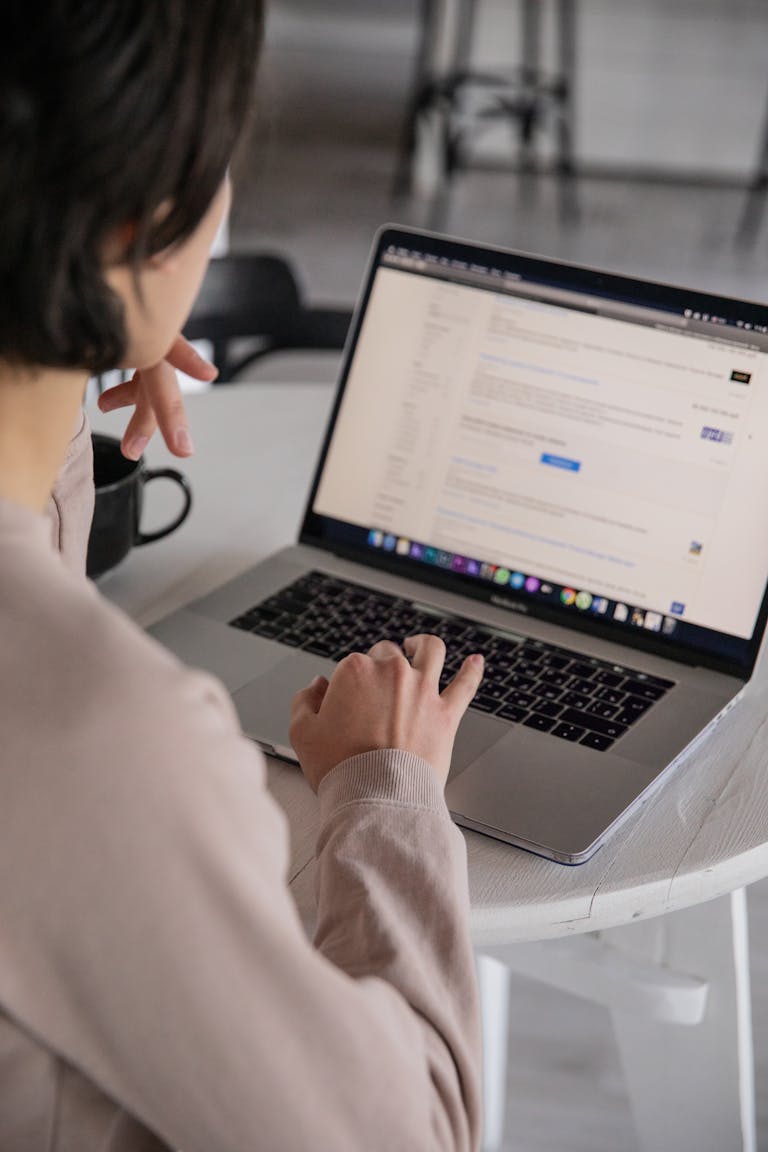
Workshop 21 April: Visualize your research using Python
Welcome to this half day workshop 21 April that will cover the Python tools you need to visualize your research. Register here.
-
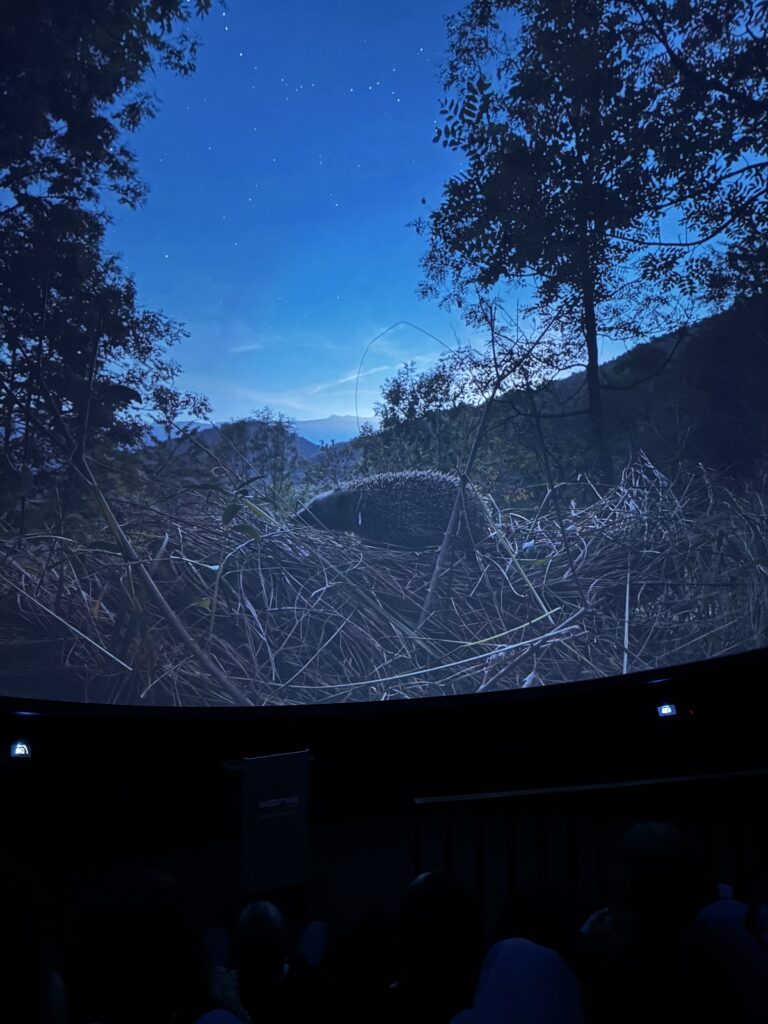
InfraVis at the Industry Premiere of Darkness Matters
InfraVis recently joined the industry premiere of the dome film Darkness Matters by Costanza Julia Bani at m:brane in Malmö. InfraVis contributed to the…
-
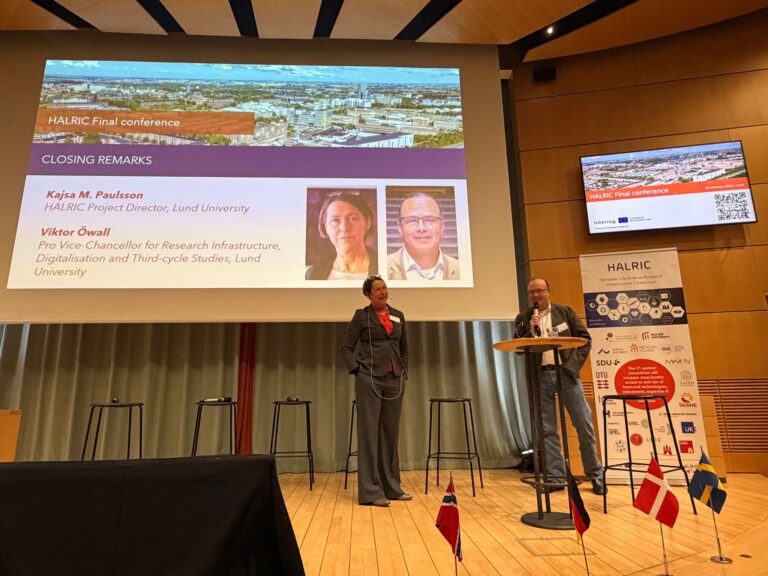
InfraVis at HALRIC final conference
Cross‑border data collaboration is essential for unlocking the full value of major research infrastructures. The final HALRIC conference highlighted how coordinated expertise from QIM…
-
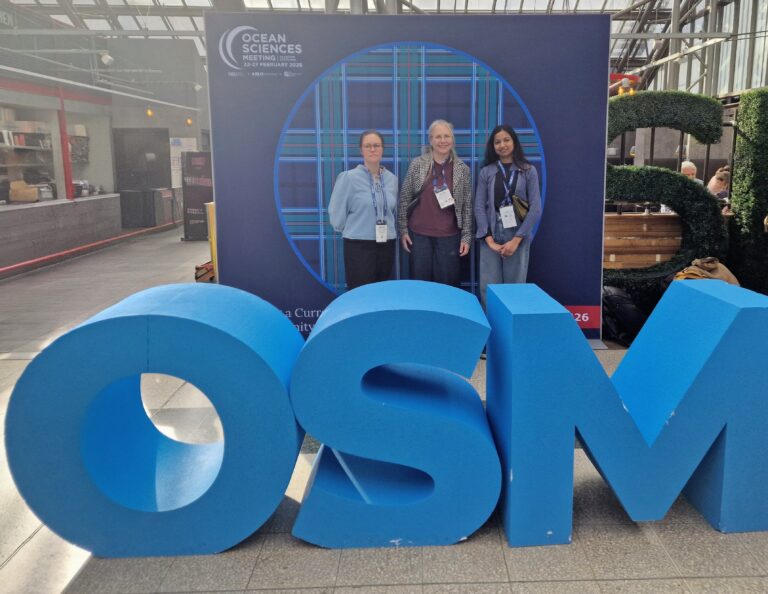
InfraVis at the Ocean Sciences Meeting in Glasgow
InfraVis contributed to the Ocean Science Meeting in Glasgow, where Helena Filipsson and colleagues presented work on artificial cod reefs, VR‑based marine outreach, and…
-
Workshop: Visualize your research using Python
Welcome to this half day workshop 11 March that will cover the Python tools you need to visualize your research. Register here.
-
Workshop: NodeGoat
Welcome to this workshop in NodeGoat offered by InfraVis and CDHU 19 March 2026. NodeGoat is a web-based instrument designed for visualizing data from…
-
Express your interest to use InfraVis in your next application to the Swedish Research Council (VR) — It is easy!
Planning to apply for support for a research project? You can now easily express your interest for InfraVis in your grant application by simply selecting us from the dropdown menu…
-
InfraVis Days in Växjö
Our upcoming InfraVis Days will be held at Linnaeus University, campus Växjö 21-23 April 2026. We are so excited to spend a few days…
-
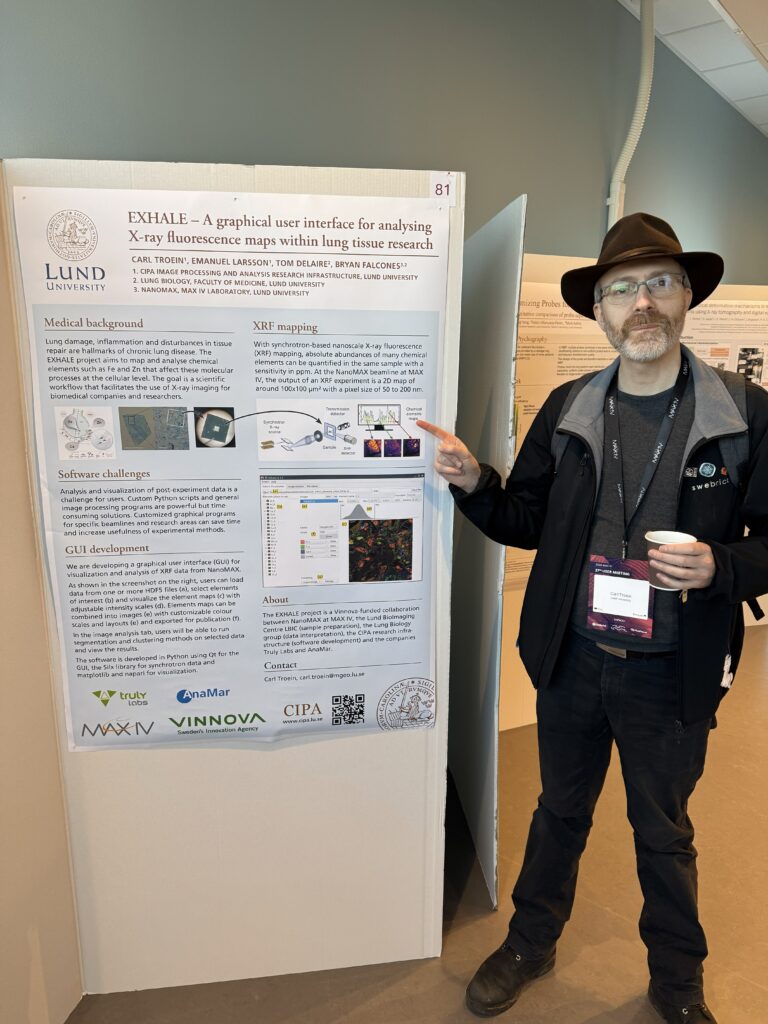
InfraVis at the 37th MAX IV User Meeting
InfraVis presented two posters at the 37th MAX IV User Meeting in January 2026.
-
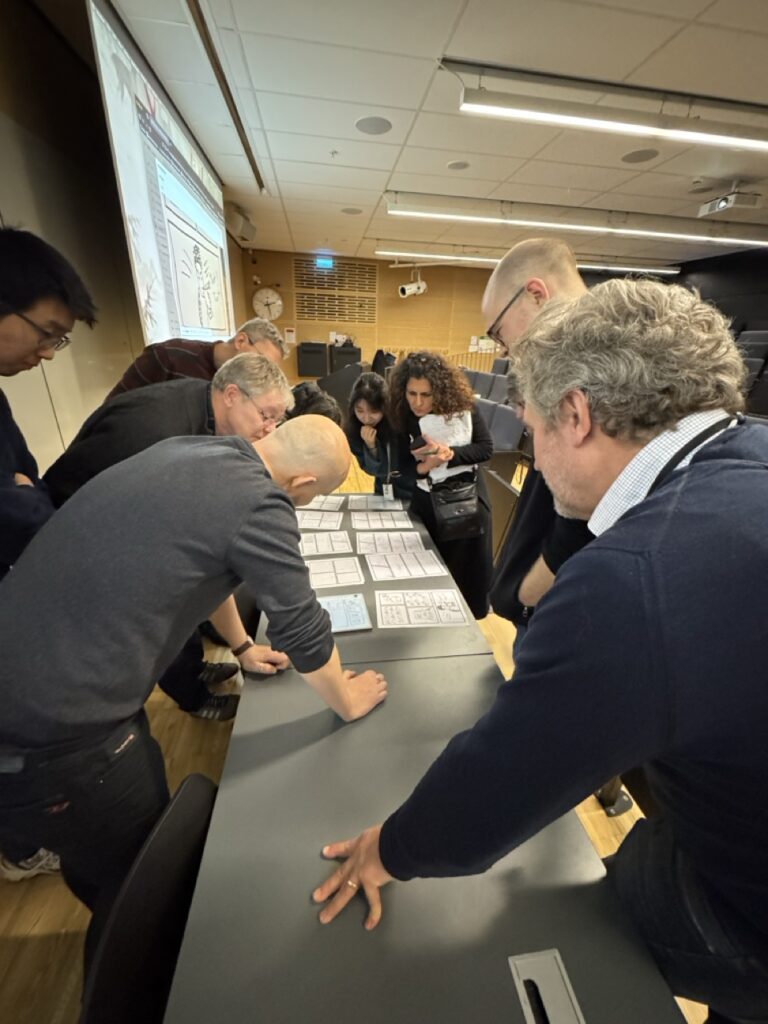
COMPUTE 2025
Two InfraVis nodes were represented at this year’s COMPUTE meeting at Lund University, an event aimed at all COMPUTE members and COMPUTE associates. The…
-
Workshop: Python
InfraVis, together with NAISS UPPMAX, HPC2N, and LUNARC is providing an introduction to Python and Using Python in an HPC environment. Dates: 27-28 November & 1-2…
-
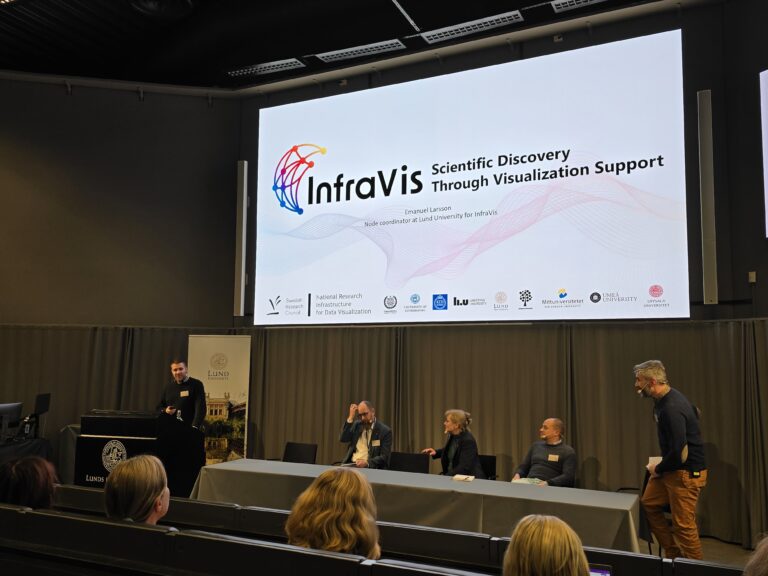
InfraVis Presented at LU Open Science Days
Emanuel Larsson, InfraVis node coordinator at Lund University, delivered a presentation at the Lund University Science Days on 19–20 November.