Inspecting tomographic datasets and Protein Data Base files in Augmented Reality – the perfect tool for an immersive poster session
InfraVis Collaborators
LINXS
InfraVis Application Expert
Gunter Alce (lU), Jonas Ahlstedt (LU)
InfraVis Node Coordinator
Emanuel Larsson (LU)
Tools & Skills
WebAR, GitHub, Blender
Keywords
Augmented Reality
Background
The InfraVis node at Lund University has developed an application and workflow to visualize tomographic datasets in Augmented Reality. The workflow was originally made for the LINXS hackathon SynchroMage: 3D Tomography and Visualisation for Earth’s Hidden Treasures – Environment and Climate theme, but after a positive evaluation from participants, also described in the following LINXS article, we have kept the development going, and have now also included support for visualizing Protein Data Base (PDB) files.
Target audience and interactions
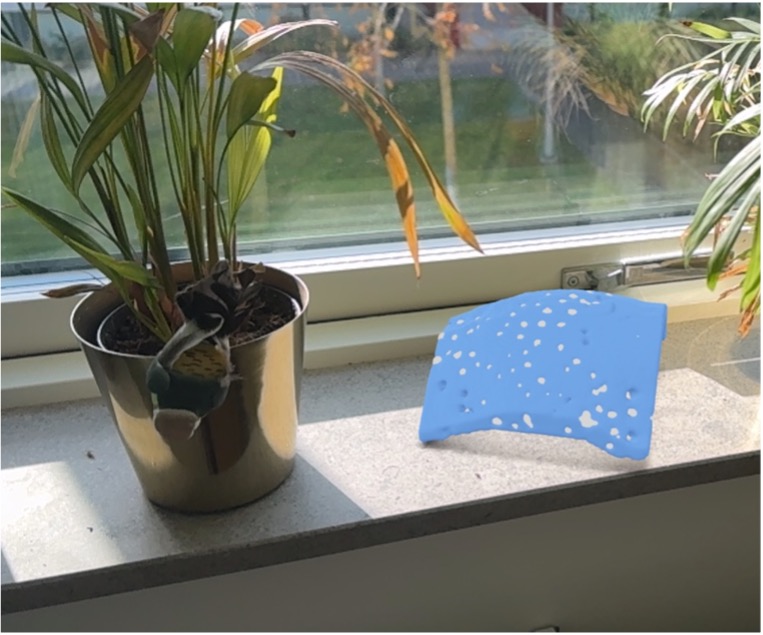
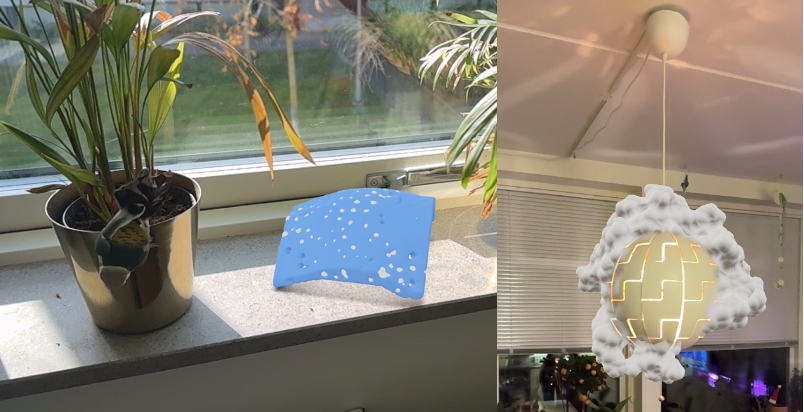
Individual users can experience and inspect their data in 3D, using their phones. They can walk around the data, enlarge it, and virtually move it into new sceneries in the given physical environment, as observed via the phone camera. Beyond letting researchers experience their data in a new and interactive way, the vision of the project is to allow researchers and students to better explain their data to their peers, e.g., during a poster presentation, where visitors can scan a QR code on a poster and then start the AR application, which does not require any installation, as it runs through the browser on the phone.
How the AR application is built
The AR application is built using WebAR and runs directly in the mobile web browser without requiring additional software installations. The implementation utilizes modelviewer.dev to render 3D models and supports interaction via touch gestures and device movement.
Technical Details:
- The application is web-based and requires only a standard mobile browser.
- It works on both Android and iOS devices, by converting the OBJ files to USDZ and GLB formats.
- Users can interact with 3D models by zooming, rotating, and moving them in AR space.
To make it accessible to a broader audience, the project has been open-sourced. Users can fork the repository from GitHub, allowing them to create their own projects, modify the interface, and upload their own 3D models for visualization. The GitHub page provides a more detailed tutorial, ensuring users can easily set up and use the system for their datasets.
Workflow – preparing the datasets
After segmenting the data in ImageJ (or your preferred segmenting software) it needs to be converted into a mesh. In ImageJ this is done using the 3D viewer plugin – by choosing an appropriate threshold an iso-surface can be extracted and exported as an STL or OBJ file (mesh format).
PDB files can be exported directly from chimera after importing them from the PDB database (https://www.rcsb.org/). The best way is to import them directly into chimera via the command line and then export them as either .stl or .obj files.
These files can be opened as meshes in Blender where they can be prepped for implementation into the AR application. Preparation includes, but is not limited to, making sure the meshes are manifold, optimizing geometry (tris count), checking normal, UV-unwrapping, greater control over transformational properties such as scale and rotation. The new mesh is then exported in two different formats, i.e., USDZ and GLB.
Further information
Code & Tutorial: https://github.com/gunterAlce/webar-tutorial/

Or click here if you are accessing this page directly from your phone: https://gunteralce.github.io/webar-tutorial (stable version – only 1 dataset)

Or click here if you are accessing this page directly from your phone: https://gunteralce.github.io/webAR-example/ (beta version with sample selector – 3 different datasets)