GIS Benchmark Tool for Environmental Impact of Quarries and Mining Industry
InfraVis User
Gauti Asbjörnsson
Johanna Lindgren
Emma Widell
InfraVis Application Experts
Liang Zhou
Emin Zerman
Funding
EPD Berg
Registration number 2023-02728
InfraVis Node Coordinator
Mårten Sjöström (MiUn)
Open Data
Data will be open when research period ends.
Background
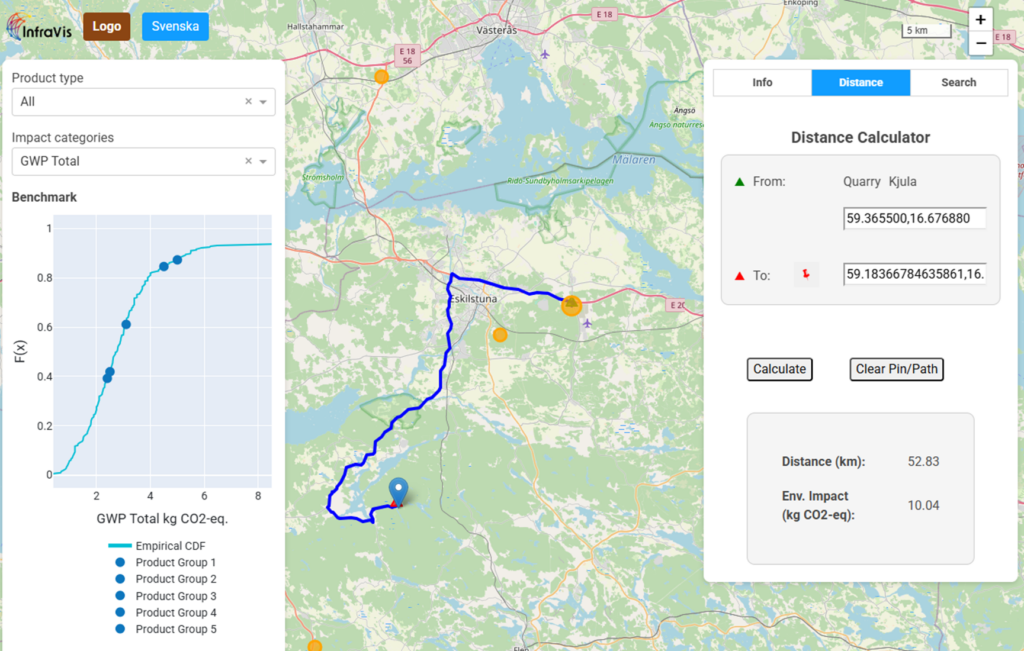
QuarryGIS is an interactive environmental visualization and benchmarking tool built to make quarry and construction sector impacts tangible for producers, clients, and planners. The web app combines environmental lifecycle assessment data with geospatial context. Users can filter quarries by product type, explore benchmarks per impact category, and view sites on a live map.
Challenges and Opportunities
Quarry environmental data is complex: products differ, locations and transportations vary, and clients need a relatable view that links numbers to geography. A central challenge was weaving benchmark charts, multilingual labels, and geospatial routing into a single, coherent experience without overwhelming the user.
API reliance posed operational constraints—Nominatim for geocoding and OSRM for routing can throttle busy workloads—requiring careful UI feedback, fallbacks, and clear guidance on usage limits. Data management also demanded rigor: configuration in definition file, EPD spreadsheets, and geo-location files must stay aligned while remaining editable for future datasets.
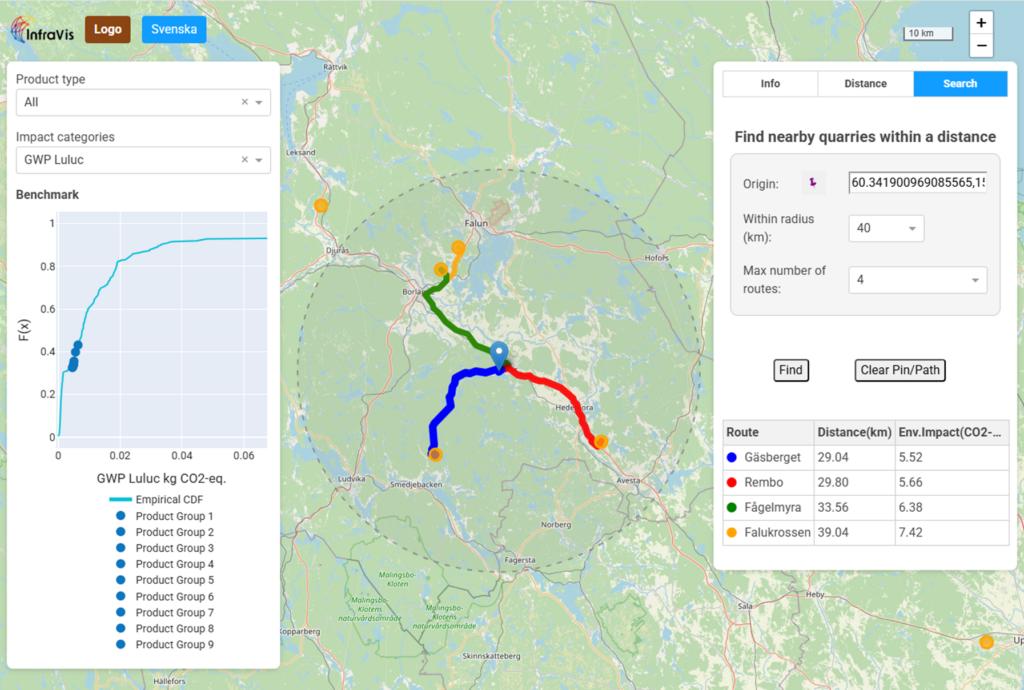
These challenges surfaced opportunities: interactive filters reveal best-performing quarries by product group; route comparisons expose transport emissions that often dominate footprints; and search tools encourage planners to consider proximity in sourcing decisions. The project also opens doors for extending to alternative GIS services, adding more impact categories, and experimenting with clustering or scenario analysis that could further strengthen sustainable procurement.
Project Process
The team began with prototypes that proved the essentials: plotting quarries precisely, highlighting nearest sites, and calculating distance-based impacts from any origin or destination. Building on that, the existing Benchmark tool was integrated into a unified interface, sharing styling, layout, and state across tabs. Front-end work focused on clarity: a left-hand selection panel harmonizes product and impact filters; top-right tabs separate Info, Distance, and Search flows; and modal help around the InfraVis logo communicates project backing. Data plumbing used helper modules to collect and sort product types from EPD data, define default impact categories, and manage language strings. The layout balances map readability with data density through layered panes—routes below markers, scalable zoom controls, and tidy side panels—while keeping responsiveness via full-height containers. Production readiness was addressed by packaging with Waitress for reliable serving, threading a browser opener to avoid manual steps, and providing two installation paths (executable zip or Python virtual environment). Throughout development, interactive controls were tuned: pin-to-place buttons for origin/destination, dropdowns that cap radii and route counts, and tables prepared for dynamically injected results.
Results
The delivered application offers a cohesive experience that blends benchmarking, mapping, and routing into one portal. Users can: (1) filter quarries by product type and impact category, immediately seeing benchmark shifts; (2) pick a quarry and compute distances and emissions to any address via the Distance tab; and (3) search from any origin to the nearest N quarries within a chosen radius, with per-route distance and CO₂-equivalent impacts displayed in structured tables. Localization hooks and clear configuration files make updates straightforward, while executable packaging lowers the barrier to adoption. The result is a decision-support tool that translates environmental performance into spatial insight, helping planners reduce transport emissions, producers showcase lower-impact products, and clients compare sourcing options with confidence. With online APIs abstracted behind clean controls and data files kept editable, the project is ready for continued expansion—whether integrating alternative GIS services, adding richer impact categories, or embedding the tool within broader sustainability workflows. Together, these outcomes demonstrate a practical, communicable path for making quarry environmental data accessible and actionable.