GenomeLens
InfraVis User
Nathaniel Street, Tanja Slotte, Andreas Wallberg, Per Unneberg
InfraVis Application Expert
Amilcar Soares, Ahmad Abdou, Matteo Tomasini, Kajsa Palm
InfraVis Node Coordinator
Evelina Liliequist (UMU)
Maria Podkorytova (UMU)
Tools & Skills
Frontend development, JavaScript, Node.js, Gosling.js
Keywords
Population genomics, Evolutionary ecology, Conservation genomics, Visualization interface, GUI
Background
What is the genetic basis of adaptation and speciation? Which populations are at risk due to environmental change? Studying and monitoring genetic variation is crucial to address these questions and guide conservation strategies given the current biodiversity crisis. While new genome sequencing technologies can detect genetic variation in any species, we lack efficient tools to easily visualize and interpret this variation. Compared to other research fields such as biomedicine or structural biology, population genomics lacks scalable and interactive visualization tools. Available tools have narrow scope and limited interfaces, and researchers spend time and resources re-implementing basic and static visualizations of their data.
Project Description
The aim of the project was to produce the novel interactive tool “GenomeLens”, that uses genome sequencing data to visualize genetic variation along chromosomes within and between populations. We implemented this application to be easily installed on a local machine, or on a server. We made use of tools such as the Gosling.js Javascript toolkit that interactively renders genomic data in a web browser, which uses the upstream tool HiGlass for data delivery. By building on pre-existing tools, we were able to focus on creating a product that can be used by the researchers out-of-the-box, while this design also means that GenomeLens can also benefit from future community-developed visualization plugins for these tools or enable external developers to develop their own plugins for GenomeLens. It is an open source tool distributed under the AGPL license.
Genomics visualization requires substantial time investments and training by researchers, typically involving coding in R or other scripting languages or domain specific tools to produce static images that showcase subsets of the data. By being able to load and display both genome annotations and quantitative data, GenomeLens offers a way to quickly assess patterns of genetic variation along chromosomes using a point-and-click interface and no custom coding. This allows researchers to easily interrogate datasets, link patterns of variation to genomic features, e.g. to help discover genes that may be important for adaptation to different environments, detect populations that may have low levels of genetic variation and resilience to climate change or those that may be hybridizing with closely related species. GenomeLens will offer unprecedented possibilities to interactively study genetic variation in any species at any scale (a “Google Maps” for the genome) and share the interactive visualizations with others through interactive web-sites or produce publication-quality visualizations. As a tool designed to simplify and improve common needs in ecological genomics, it allows researchers to shift focus from repetitive visualization tasks to major biological questions, optimizing resource use and accelerating discovery and biodiversity research.
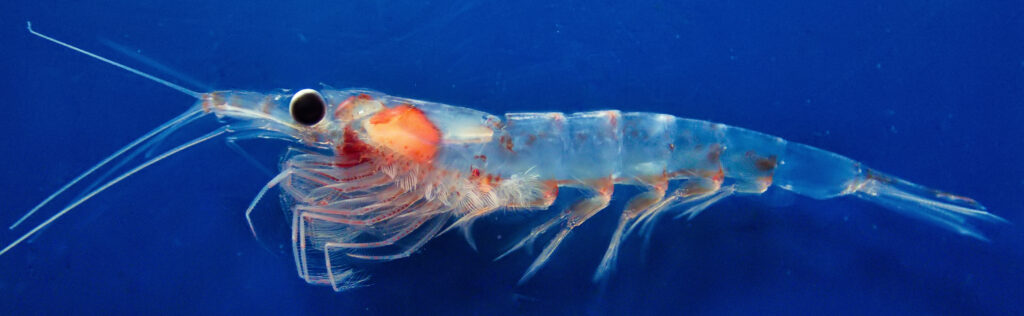
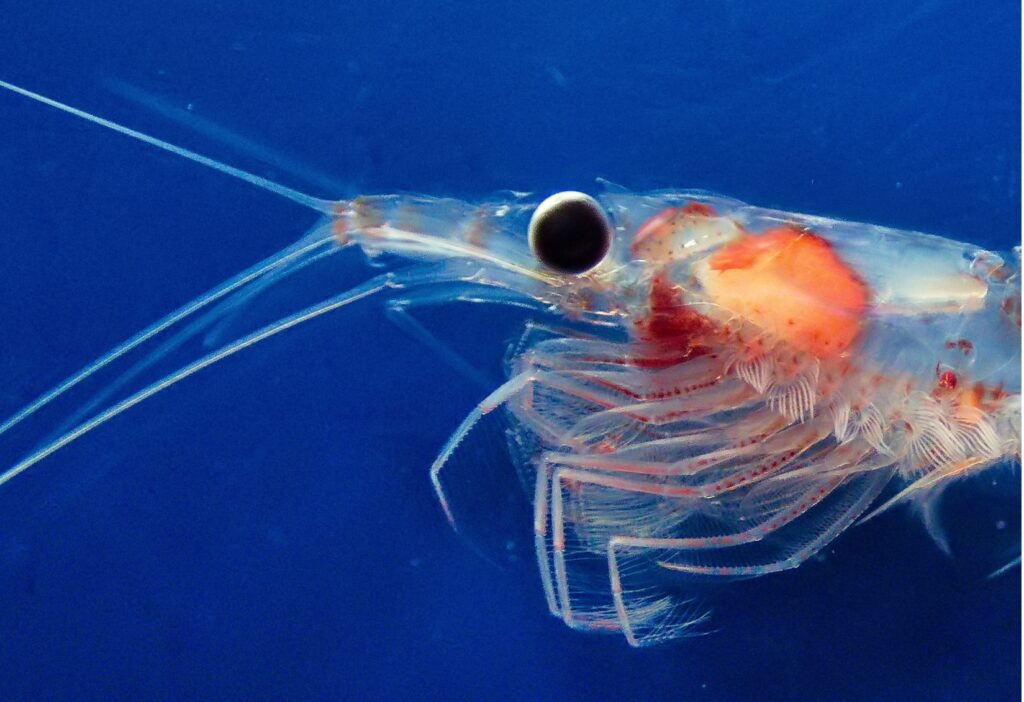
Photo: Andreas Wallberg
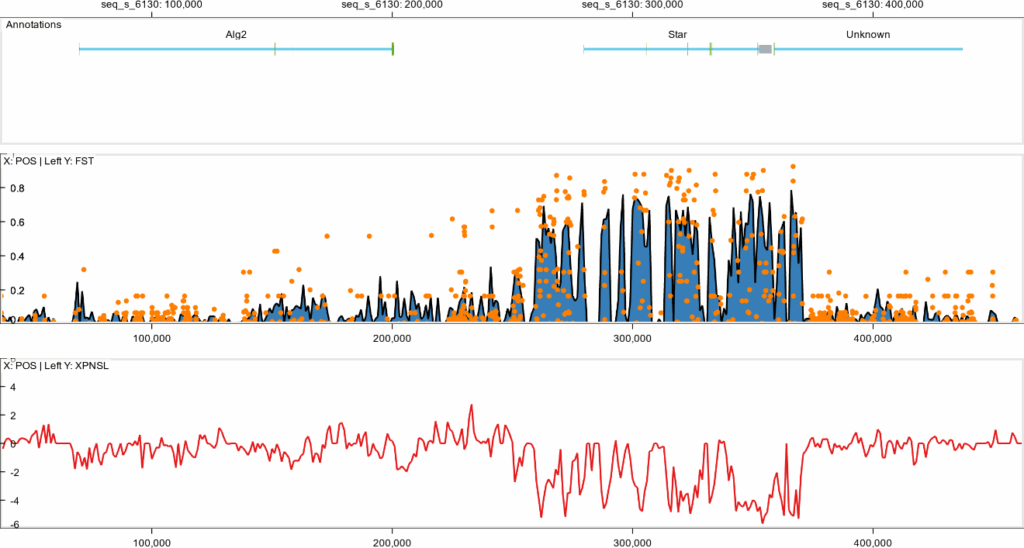
Figure 1.
A multi-track GenomeLens visualization of a ~400,000 bp region of a chromosome in the Northern krill (Meganyctiphanes norvegica). The top panel shows the location of three genes (Alg2, Star, and an unnamed gene). The middle canvas shows a comparison of genetic variation between an Atlantic and a Mediterranean population of the krill. The middle panel highlights high FST values at Star, indicating genetic differentiation between Atlantic and Mediterranean populations (window-based line/area plot in blue; SNP data as orange dots). The lower panel shows reduced genetic variation in the Atlantic population (negative XP-nSL), consistent with a selective sweep. Star, involved in eye development and sleep regulation, may have evolved under natural selection to adapt Atlantic krill to local light conditions. This is an example of genetic adaptation to the environment through natural selection.
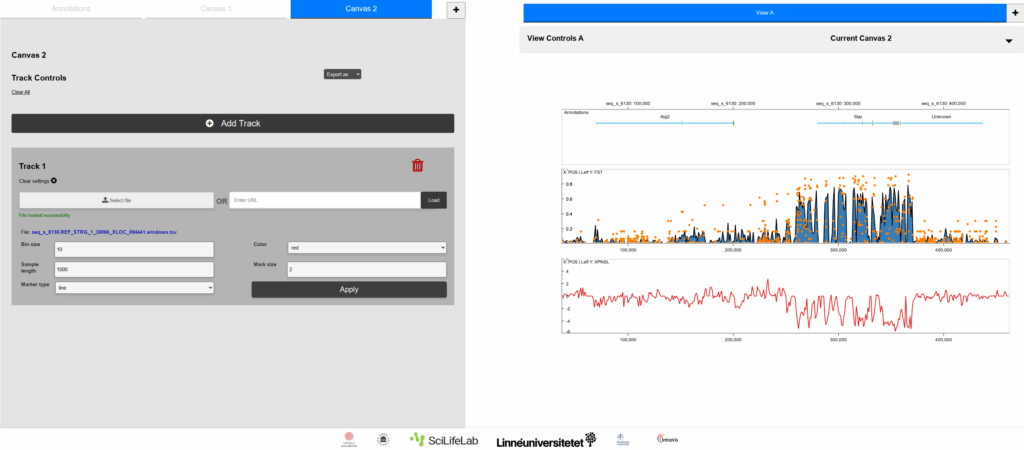
Figure 2.
The same plots as in Figure 1, in the context of the GenomeLens graphical user interface. A series of canvas and track controls allows the researcher to control and quickly visualize the data.