Dynamically Visualizing high-dimensional datasets using parallel coordinates plot
InfraVis User
Dimitrios Kourakovounis (KTH),
Jörg Conradt (KTH)
InfraVis Application Expert
Filip Berendt (KTH)
InfraVis Node Coordinator
Mario Romero Vega (KTH)
Tools & Skills
CSS, D3, HTML, Information Visualization, JavaScript, Parallel Coordinates
Keywords
Neural Computing, Convolution Kernel, Receptive Fields, Image Processing, Neural Network, NCS Lab
Background
Associate Professor Jörg Conradt and his PhD student Dimitrios Korakovounis of the Neuromorphic Computing Systems Lab are doing research trying to better understand Spiking Neural Networks. More specifically, Dimitrios has a project which involves image processing of objects in motion. In this project, he is “training” an array of different image convolution kernels, called “Receptive Fields”, to present more accurate readings of the images processed. These Receptive Fields are defined using six different parameters, they have a measured metric of how ‘active’ they are, and they are trained over a number of timesteps. The idea is to ‘silence’ poorly performing fields and that the better will remain active in some capacity.
One major challenge in Dimitrios’ research is identifying the effect of the Receptive Field’s parameters in its activity response and key to this is understanding the evolution of the parameters and activity of individual Receptive Fields as training progresses, which has proven difficult with the methods available to him. The data of these fields are essentially 8-dimensional, which is normally considered ‘high dimensionality’, which is notoriously difficult to visualize without making some major concessions for how the visuals would look. Below are some of Dimitrios’s own figures before reaching out to InfraVis.
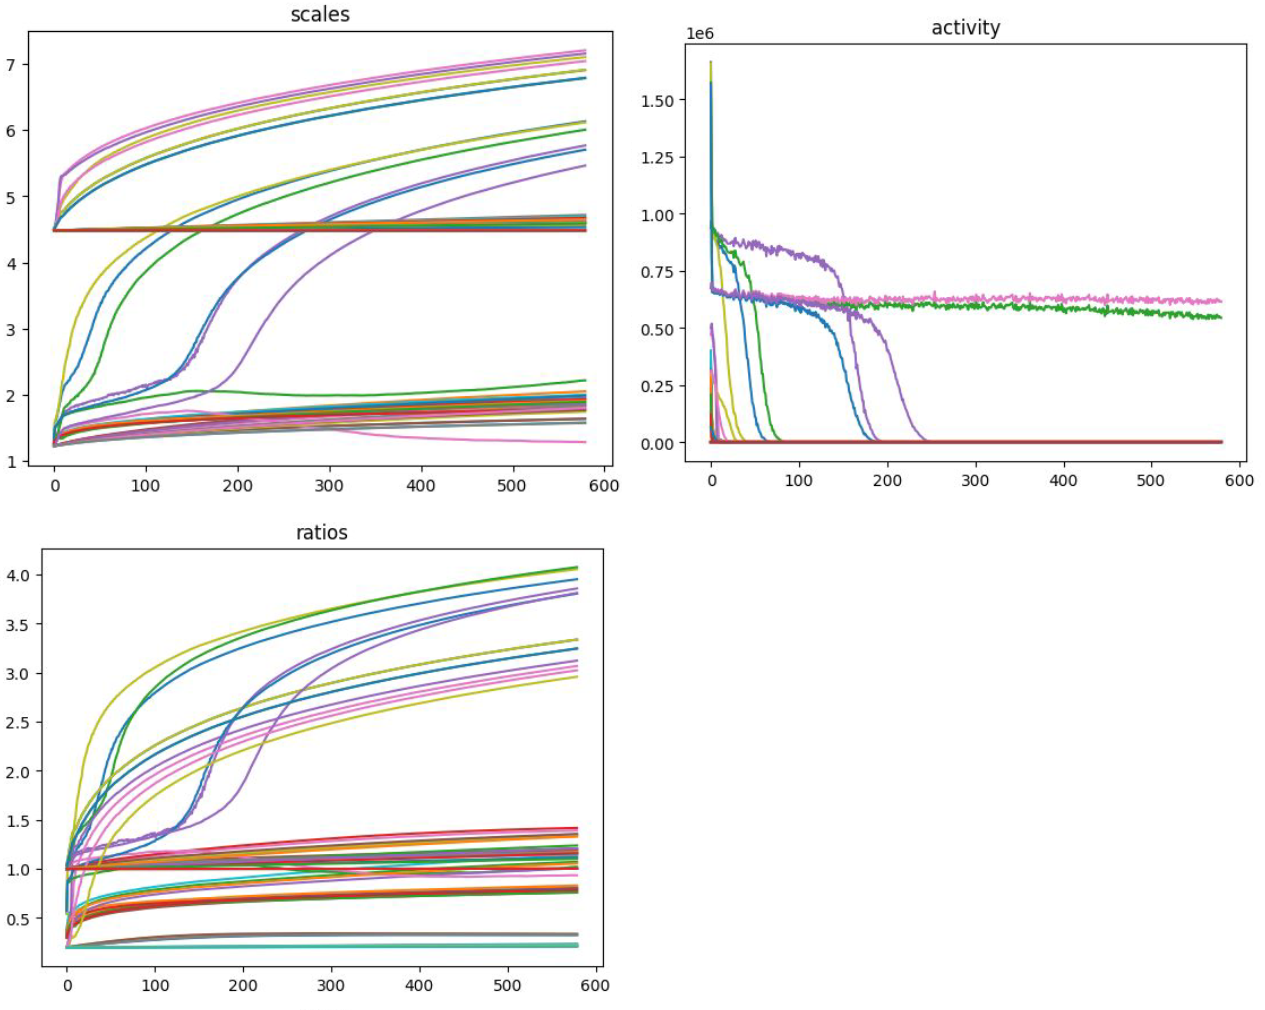
Can you see what ratio and scale defines the two kernels that have remained active to the end? Maybe, but it is not easy.
Is there a way to cohesively display all 8 dimensions in a single figure, that doesn’t sacrifice details and relations, that also makes sense to the reader? Yes, there is with parallel coordinates and the research team applied in our 2023 call for applications to find out. Also, this proposed solution is not necessarily limited to this specific field of research, so making this tool at the very least compatible with other datasets would remain a priority, even if it is being designed to fit the needs of the user.
Source(s) used: Dimitrios Korakovounis
Project Details
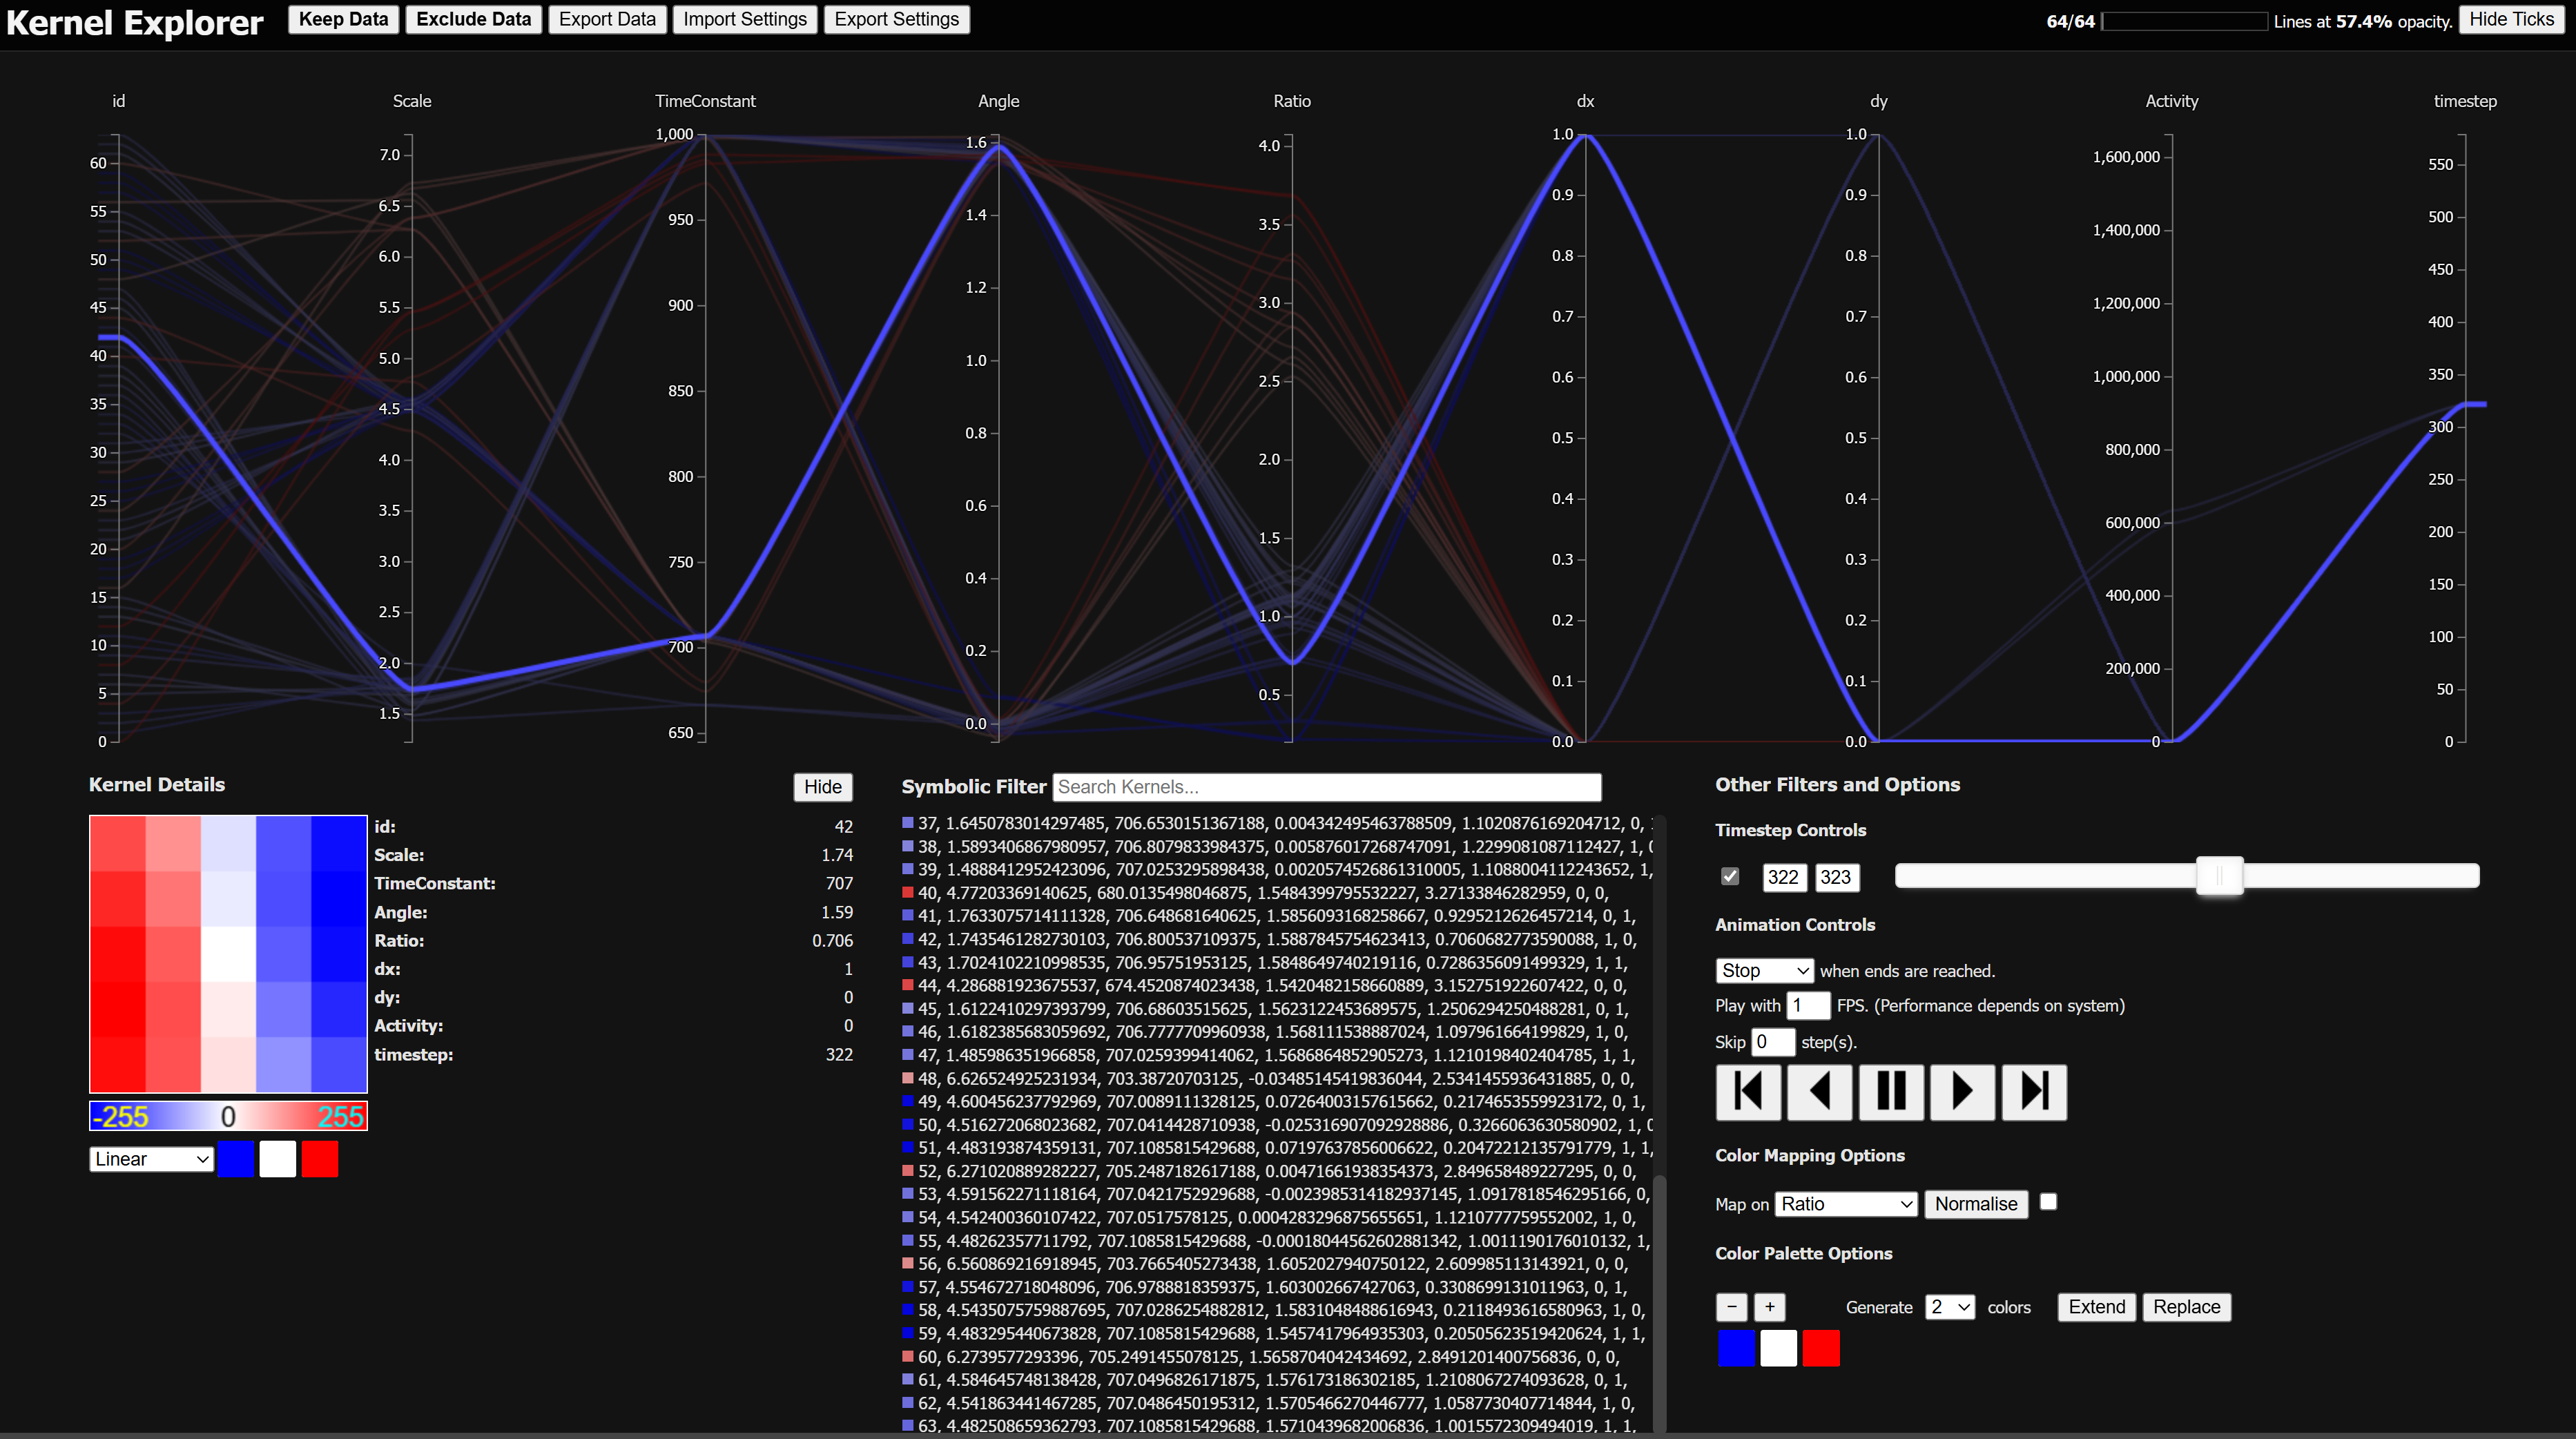
For those unfamiliar with Parallel Coordinate plots, it is explained in excellent detail here. However, there are certain features that the parallel coordinate plot facilitates, that were to be expected by the user. Other than that there were some features not specific to the plot that also were expected. To avoid reinventing the wheel, we adopted and modified an existing solution, called Nutrient Explorer. It’s made using a JavaScript library called d3.js, along with some CSS and HTML formatting, making it endemic to a browser setting, which makes the solution very accessible to any system with an internet connection.
This solution already had some generic features useful to the user, but further (major) adjustments would be needed to fit his needs. The features already implemented are the following:
Brushing allows you to mark a section of an axis, to exclude all other points (or lines) that fall outside the marked area. Brushes on different axis can be combined to narrow down the selection further. In principle, multiple brushes could exist on a single axis to allow for further freedom of selection, but this specific feature is not supported.
Reordering allows you to move axes to change the order of them. If you are looking for a particular relation between two attributes, it makes more sense to have them next to each other, to more easily see their relation.
Removal allows you to remove axes that you are not interested in for your current task. This removes unnecessary clutter that does not contribute to the understanding of your data.
Inversion allows you invert an axis, to reverse the order of the data points displayed on the axis. When trying to identify positive or negative relation, it is generally helpful to more easily see then when lines between the two axes are not crossing over each other.
Searching allows you to pinpoint a specific data point, if it is of particular interest. In the nutrient explorer, this search is limited to the data point name only. For the case of the kernels, which are defined with an id and its attributes, if the search field could be expanded for all these things, that would be better.
Inclusion/Exclusion allows you to keep or remove the currently selected data points for the remainder of the visualization experience. It is useful for when you know already that certain data points are not relevant for your current viewing.
Over the time of developing this solution for the user, multiple requests were made and finally implemented. These are the following:
Settings Import/Export allows the user to save and load a particular set of interaction settings with the visualizations to/from a neat json file. This allows the user to share their view with others, to set a new default state for the experience, or continue from a particular state later. The import/export assumes the dataset remains constant between exporting and importing, but it should still do as much as possible when interacting with a different dataset.
The Symbolic Filter is an upgrade from the Search feature already in place. It allows the user to use logic expressions to match according to the attributes of the data points. The expressions are constructed using numerical comparators and disjunction and conjunction. Any expression input is interpreted as a CNF-expression.
Data Details are displayed when clicking on any of the data points listed in a list. This provide the exact details of the data point, along with a visual representation of the given data point. This selection also keeps the point permanently highlighted in the visualization, until cancelled.
Time Dimensionality Support allows the user to view their dataset as a time series. One can choose which timestep(s) to view with a double-ended slider. This assumes there is an attribute called “timestep”.
Time Animation Support allows the user to automatically animate the time domain of the dataset. It can be played or stepped (with a certain amount of steps to skip) forward and backward and loop, reverse, or stop on reaching the end.
Color Mapping Options allow the user to render the data points with a certain color range with regards to a certain attribute of the user’s choice. The color mapping can be set to be normalised according to the currently shown selection, with an option to do so automatically when the selection updates in any shape or form. The user can also select the color palette to use for coloring the data points.
With the given goal for the project to be somewhat reusable in entirely different context that still need dynamic parallel coordinate plots, the entire project is made to accept any set of attribute names, provided that all the data is numeric (ordinals, and to lesser extent nominals, could at the very least be processed to numeric before being displayed), and if one of those is called “timestep”, options for exploring the dataset in a temporal domain is made available. All the attributes present in axes, symbolic filter, color mapping options, and kernel details are dynamically loaded from the input data. Some special features are obviously missing, and the special features implemented here could be considered superfluous, but at least the core experience independent of any context is there.
Access to this solution is provided upon request, and any new users will need to find a way to process their data to the format that is used in the solution.