Exploring research data
From visualization in Python to dimensionality reduction and geographic data, researchers spent a full day exploring different ways of working with complex research data in Uppsala.
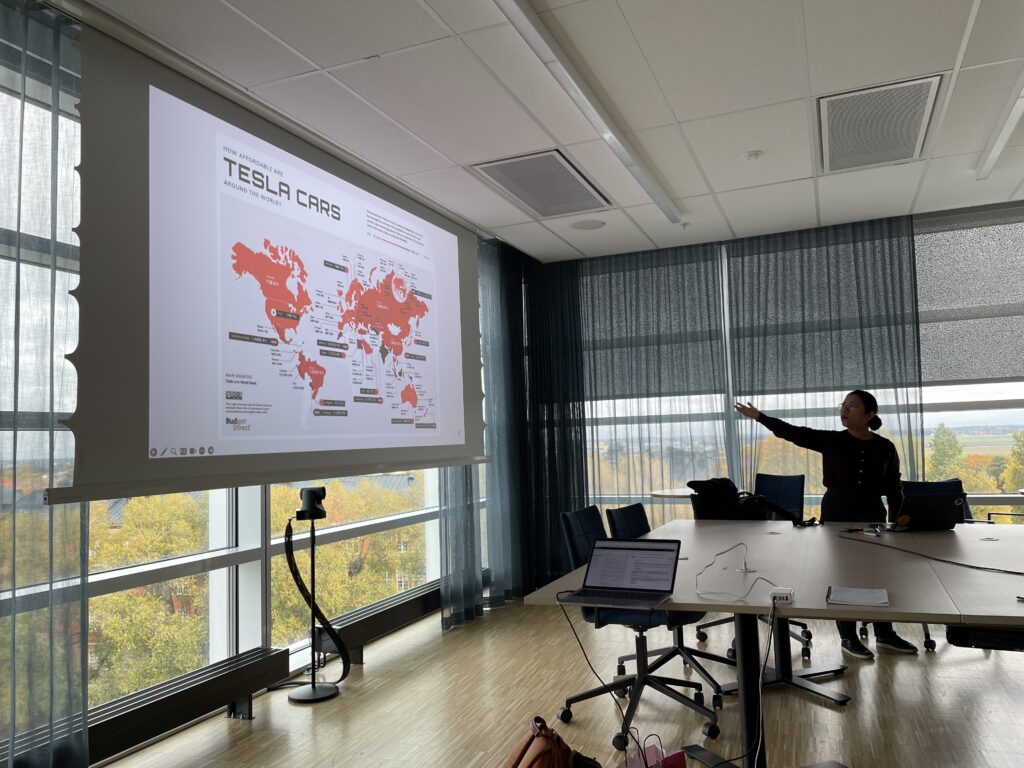
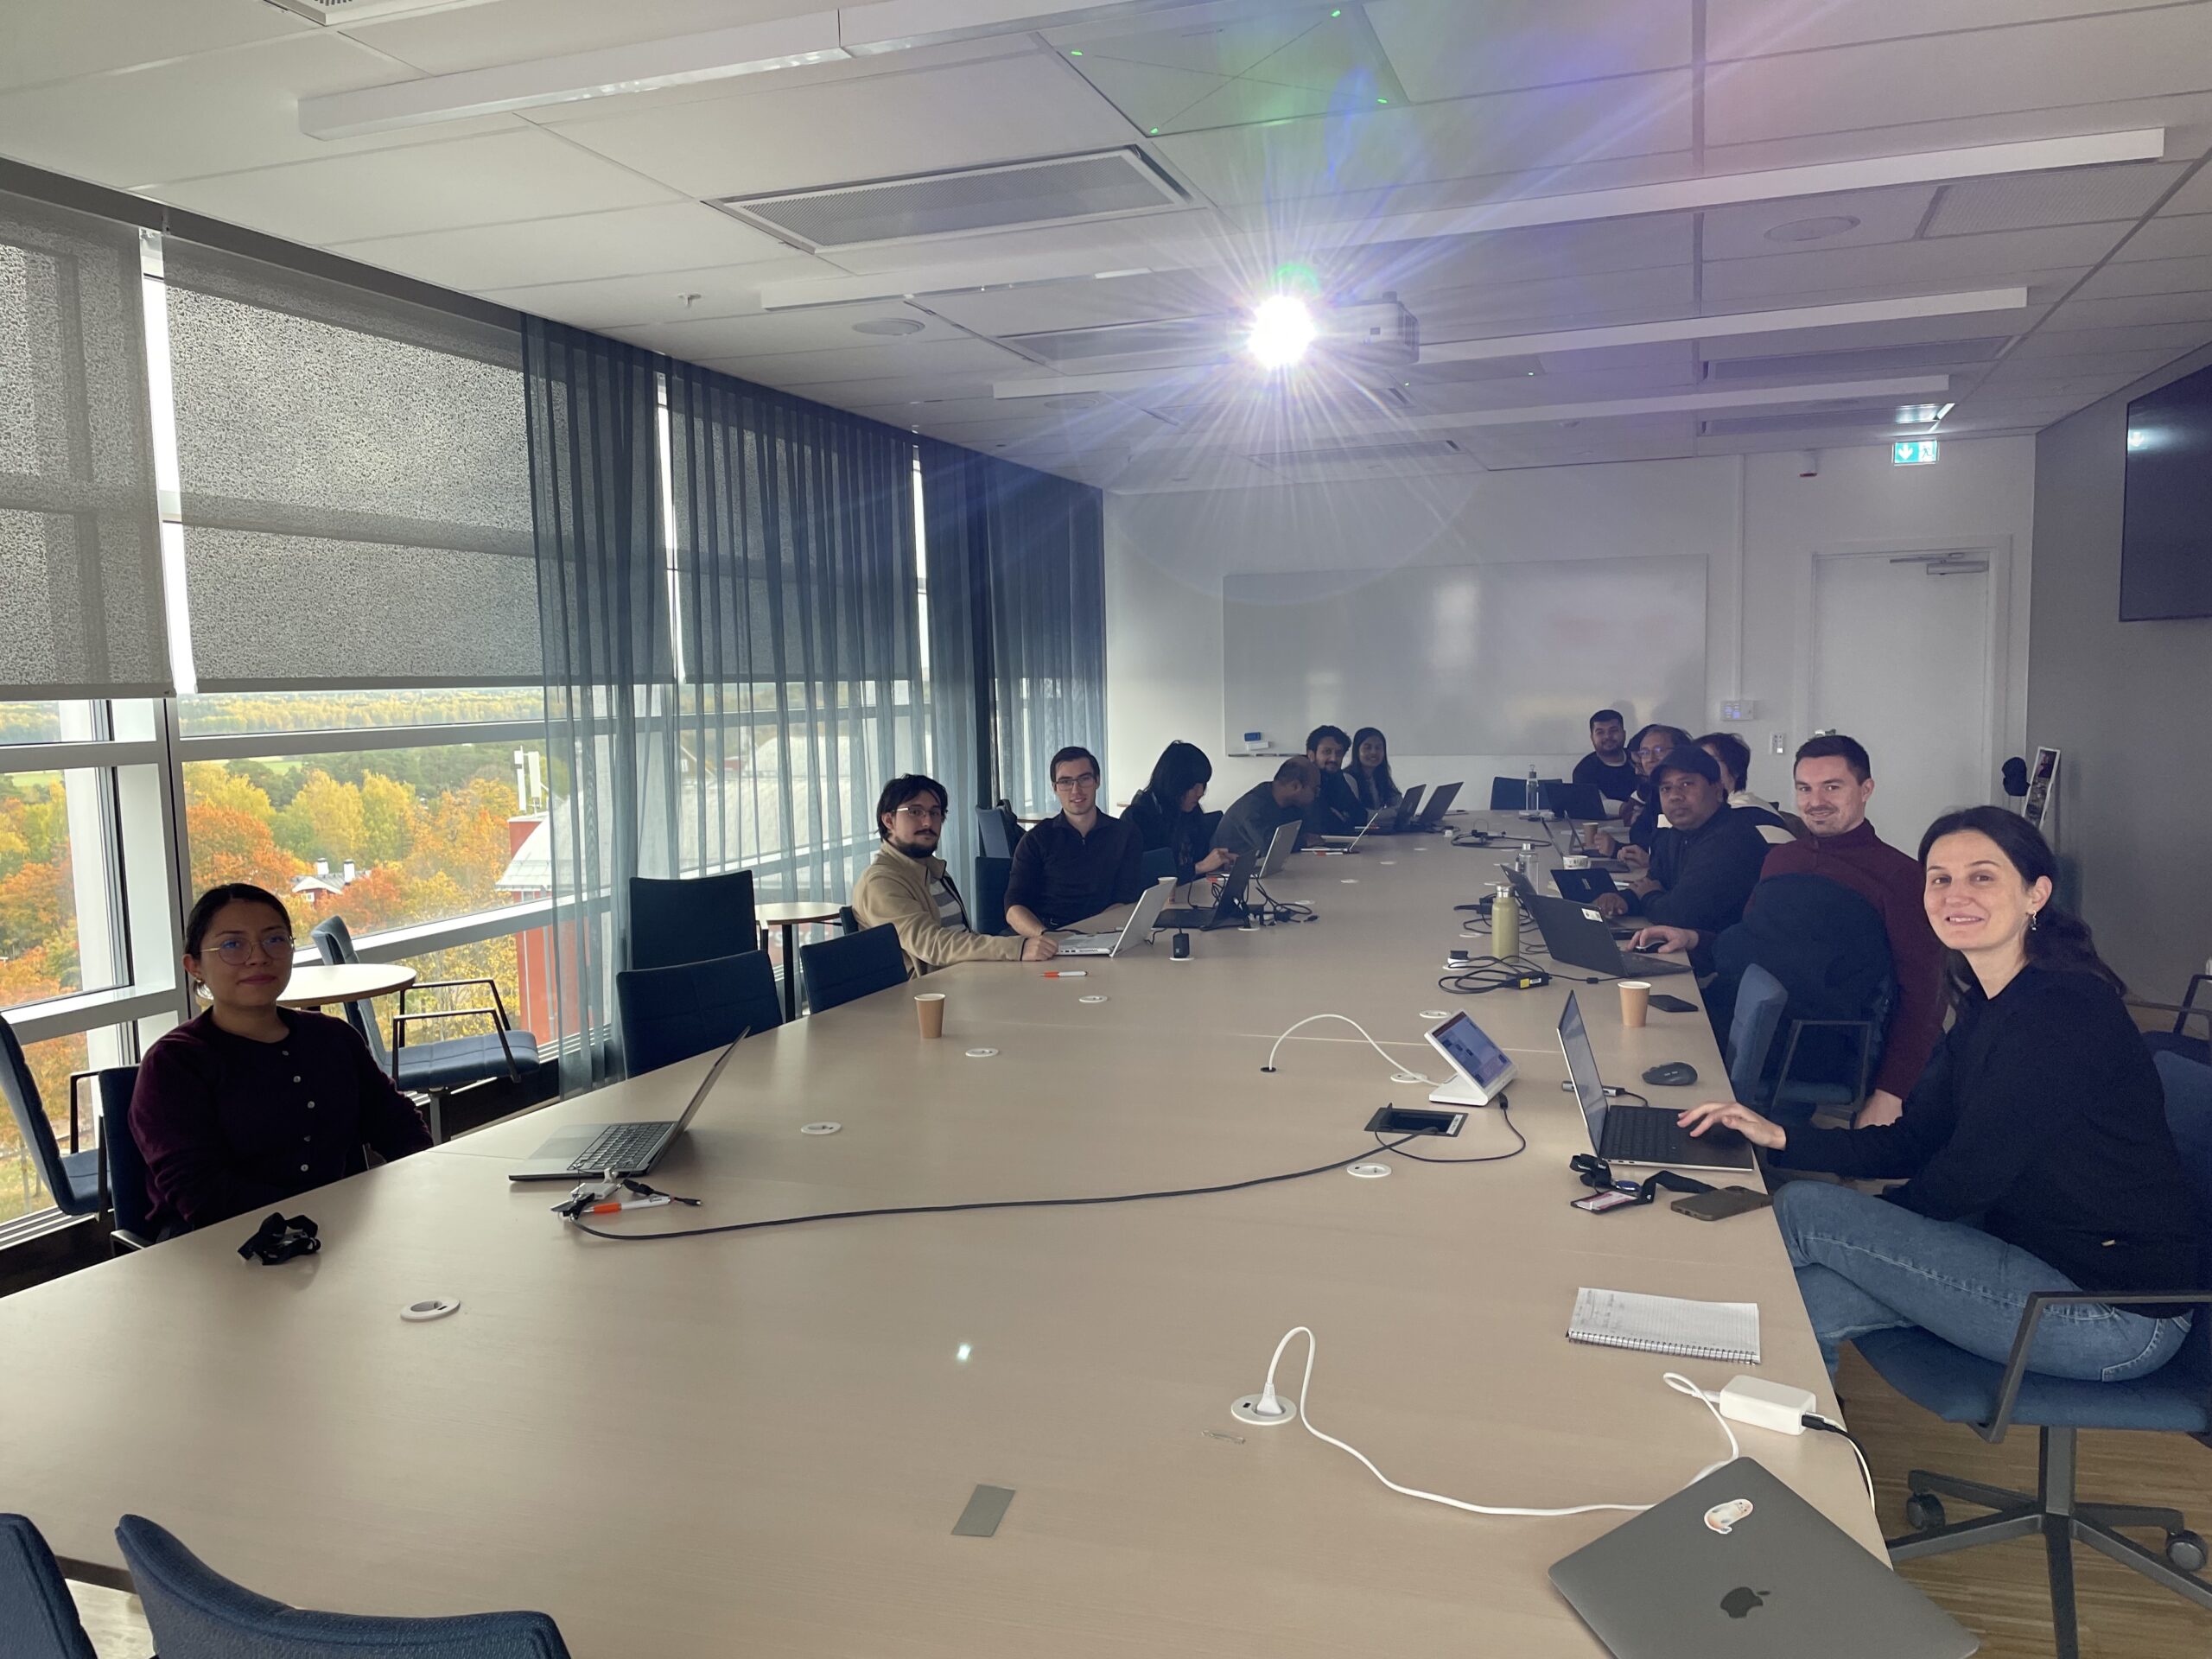
On 13 October, InfraVis’ Uppsala node and the Centre for Digital Humanities and Social Sciences Uppsala (CDHU) hosted an InfraVis Satellite Event as part of the Swedish E-Science Academy’s satellite programme. The workshop brought together 22 participants for a mix of presentations, practical examples and discussion.
Co-organiser Anders Hast opened the day with sessions on static and interactive visualizations in Python and tools for exploring high-dimensional data. After lunch, Dalia Ortiz Pablo took the group beyond scatter plots, introducing other approaches to visualizing complex datasets.
The afternoon turned to geographic data, with two sessions exploring different aspects of geographical visualization, including an introduction to Geographic Information Systems by Vasiliki Tsoumari.
Perhaps the most encouraging feedback came after the workshop: several participants said they had already started applying the dimensionality reduction techniques to their own research. A good sign that what was explored during the day had already begun to travel beyond the workshop room.